
In one line: a setup is tradable only if, before you know how it turns out, you can separate it from the look-alike bad charts using conditions you can actually see.
Lesson 5 of the 30-part Trading Decisions course. By Eliza.
Lesson map
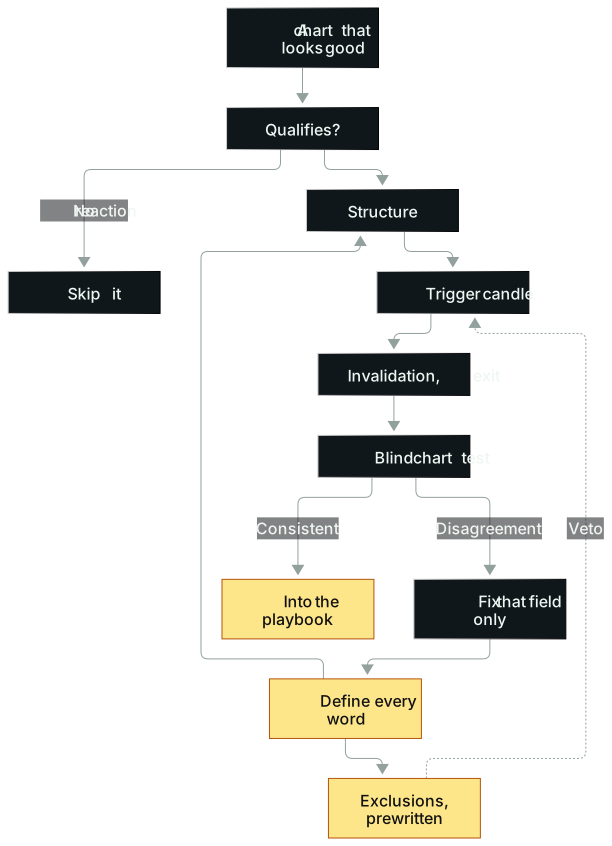
In words: (1) A chart that looks good first has to qualify: if the market isn't reacting to the stock, it doesn't count and you skip it. (2) If it qualifies, check structure (location, consolidation), then the trigger (one candle), then write the invalidation and exit. (3) Exclusions are written in advance; a hit vetoes the trade before the trigger. (4) Define every word you use; those definitions govern both the structure check and the exclusions. (5) Then run a blind test on truncated charts. Big disagreement: change only the disputed fields and go back to the definitions. Agreement: add it to the playbook and start testing.
Opening: the guy who shorted one kind of chart
One trader who later specialised in shorting small caps started out working a retail job for a bit over a hundred dollars a week. Something in his personal life gave him a jolt, so he looked up the fastest way to make money in America. Two answers came back: real estate and stocks. Real estate needed serious capital. A brokerage account needed a few hundred dollars. He picked stocks.
In year one he discovered a remarkable talent. Every time he bought, the stock went straight down. He lost all year.
In year two he learned to short. The logic was simple: if it drops whenever I buy, I'll just hit the other button. His first short was 1,500 shares near $4. It fell 60 cents and he made $900, the most he had ever made on anything. He fell in love with shorting and started shorting everything.
Year two finished at breakeven. Looking back, he put it plainly: shorting everything isn't a process. He needed something repeatable and stable. He needed a pattern.
What he found was very specific: on the daily chart, a stock that spikes up during the day and then fades. Those stocks had behaved that way the last several times, so he bet they would again. He stopped shorting everything and shorted only that. Year three, he was profitable.
He couldn't afford courses; a decent one cost over a thousand dollars a year. He learned by trial and error, and later scaled up shorting small caps until a starting stake of a thousand or two had become well over ten million dollars in trading profits.
The part that did the work was tiny: he shrank "go short" into "short the day a stock spikes and fades on the daily." The first is an attitude. The second is a setup. You can't keep statistics on an attitude. Until you find a repeatable pattern, effort just spins in place.
The idea
A pattern existing doesn't mean it has an edge
Plenty of people think finding a "real" pattern means finding money. Take the fair value gap (FVG), very fashionable right now. Three candles: the first makes a high, the second expands hard to the upside, and the third's low stays above the first's high. The empty space in the middle is the gap.
The phenomenon is real, and a pullback often follows. But take every gap you see and it will almost certainly not pay you. Trendlines are the same: trends exist, yet "fade the trendline break" has little validity as a rule. When and where you apply a system matters as much as how you execute it.
So defining a setup doesn't mean naming a chart. A definition answers: where, when, and with which conditions all true do I count this as the setup, and everything that merely looks similar is out.
Two layers: why this stock, and where to get in
The opening range breakout is simple. Take roughly the first 30 minutes after the open, mark the high and the low, buy the break above, short the break below. Everyone can draw it. It gets ruined when people run it on sleepy stocks with no catalyst and no volume. Draw opening ranges on thin names and the chop will grind your account down.
How to draw the range is "where to get in." Which stock deserves a range is "why this one." Those are two layers and you write them separately. If you write only the entry rule and omit stock qualification, you can draw a range on any stock on any day and call a move outside it a breakout.
The first layer comes in three flavours:
| Reason to watch | Counts | Doesn't count |
|---|---|---|
| News catalyst | FDA-related data, up 10% in the first hour on huge volume | News out, price barely moves, no volume |
| Technical catalyst | Breaks a months-long key level fast, on real volume | A chart as exciting as watching paint dry |
| Volatility and range | Normally moves 50 cents, today swings $4–5, levels are clean | Choppy, illiquid, random |
The right column matters as much as the left. If the company put out news and the stock barely moved, with no volume and no range, it doesn't count. News is the cause. The market's reaction is the evidence. Qualifying a stock on the cause alone is like giving a restaurant five stars after reading the menu.
Each setup needs its own scorecard
Two "good charts" can need almost opposite things. A breakout wants a clean consolidation and a supportive market. A panic-selling reversal wants a normally boring stock that suddenly falls hard. You can score a panic reversal on five variables:
- Speed. Drifting down 3% over a whole day isn't panic. You want candles that make you physically queasy just looking at your account.
- How boring the stock is. A low-beta, sleepy name that suddenly drops 15% is more likely overreacting. A stock that already moves 15% every other week tells you nothing.
- Daily chart. Is it falling into multi-year support? Catching a stock that has fallen for six months is catching a knife.
- Intraday chart. Weighted far above everything else. If the intraday chart is bad, the rest has to be near perfect, and you might still pass.
- News. Ideally none, or only old news. A 20% drop on bad earnings and cut guidance is a repricing, not panic.
A perfect score looks like this: a dull utility stock, no news, down 11% in a bit over two hours, into long-term support, with a clear selling climax on the tape. These features may earn a high setup score, but the score alone does not justify a larger position. Any increase must follow a prewritten sizing rule supported by relevant net-of-cost results and remain within the risk budget; no identified news does not rule out new information.
Score a breakout with that sheet and you get nonsense, like grading a maths exam with a history-essay rubric. So every setup in the playbook gets its own page and its own scorecard (Lesson 24 covers scorecards in detail).
Exclusions are part of the definition
Most definitions say when to trade and nothing about when not to. Yet within one family of charts, the ones that hurt most are look-alikes with a different mechanism.
A common rule: if a stock is pinned below VWAP (the volume-weighted average price for the day), don't buy it unless there's an extreme flush and exhaustion; above VWAP, the reverse, don't short it. Watching Nvidia hold above VWAP all day, there's simply no reason to short.
The second half is what matters: what candles and what volume count as "exhaustion" for you? An undefined exception clause might as well not exist.
Exclusions also have to be written in advance. Another small-cap short seller never shorts the high of the day unless very specific playbook conditions are met. He has broken that rule. BPTH in 2019 was one time, and it still turns his stomach. Since then all his exceptions are on paper, and he won't open a loophole because he feels like shorting something more dangerous that day.
An exception written in advance is a rule. An exception invented mid-session is an excuse your emotions found. In a trade journal they look identical. The only difference is when they were written.
The method
Eight fields per playbook entry
| Field | Question it answers | Not good enough |
|---|---|---|
| Market and timeframe | Which instruments, which charts | "Stocks" |
| Environment | Market direction, volatility, big events | "When the market's good" |
| Reason to watch | News, technical or volatility, and did the market react | "It's hot lately" |
| Structure | Location, how long it based, base quality | "Nice pattern" |
| Trigger | Which candle, which price gets you in | "Feels ready" |
| Invalidation | What proves you wrong | "Get out if it's down a lot" |
| Exit | How you take profit, in how many pieces | "Depends" |
| Exclusions | Which look-alikes you skip | (blank) |
Add three more: version number, sample window, cost assumptions. When the rules change, bump the version and leave old samples under the old version. Don't mix them.
Five steps to fill an entry
- Pick one setup that fits you. For example, a post-earnings breakdown, a capitulation flush after panic selling, a reclaim of VWAP, or an upside breakout on a trend day.
- Record the context. Market backdrop, catalyst, sentiment, who's trapped.
- Screenshot and mark up. Entry, exit, risk level, and what you were thinking.
- Grade it. A+, B or C, why, and whether size should change next time — with the rule that supports that decision.
- Repeat. Keep refining, keep tracking, and size up when the data supports it.
The playbook takes only the best A+ setups. You're after quality and repetition, not volume.
Turn adjectives into numbers
The most common defect in an entry is adjectives: strong, clean, heavy volume, blow-off. One trader tagged a day in his review as a "euphoric blow-off top" without saying why. Here's a quantified version:
- The day's price range is at least 2× the prior day's; 3–5× is better.
- Volume is at least 2× the prior day's as well.
That stock's candles were accelerating: up 5 cents, another 5, then 10, then 12, then one 40-cent bar. The range was close to 4× the previous day's, and volume was maybe 5×.
Once "blow-off" reads "range and volume each at least double yesterday's," two people looking at the same chart have a chance of agreeing.
The blind chart test
Don't use the entry yet. Prepare 12 charts cut off at the moment you might have entered: 4 you think qualify, 4 you think don't, and 4 you're unsure about. The next day, hide the tickers and dates and judge them again. Mark each one "in / excluded / not enough information" and note which field decided it.
A chart you judged differently on the two days shows where the definition leaks. Change only the field that caused it, never based on what price did afterwards. "Not enough information" is a legitimate, honest answer.
More real cases
Three versions of "drop, bounce, drop"
Call it a stair-step weak bounce: a short-continuation pattern where the stock pushes down, then bounces like a ball, each bounce lower than the last. Compare three charts:
- Chart A drops, then puts in a higher, stronger bounce with one very strong green candle. The pattern requires bounces that can't clear the previous high. A fails, so there's no rush to short the break.
- Chart B bounces back a large share of the whole drop. The base isn't tight enough, and when it retests the low, there isn't enough downside force.
- Chart C is the textbook version: a drop, a weak bounce, a weaker bounce, a lower low, then barely any bounce at all, with candles very tight into the break.
Why C works: buyers should be showing up at support, yet price can't lift off it. That tells you they aren't coming. After the break, the prior candle's high is one possible trailing-stop reference. A closer stop reduces the planned price distance, but does not by itself improve expectancy; evaluate stop-out frequency, realized gains and losses, slippage and costs across a continuous sample.
All three could be called "drop, bounce, drop." Only one meets the definition. Price action keeps telling you how weak the stock really is. In an entry that becomes three checkable lines: each bounce high is lower; the bounce retraces no more than a set share of the drop; candles tighten before the break.
Which day of the breakout was ACB on?
Once, people were asked to analyse a breakout in the cannabis stock ACB, and the comments turned into a fight over whether it was day two or day three. They were fighting about the wrong thing. First you have to know why you count days at all.
You count days to judge how far the move has gone and how much is left. ACB had based between $4 and $5. On April 2 it printed a breakout candle but closed at $5, no real change from the old range. By the purpose of the rule, that wasn't day one. Count April 3 as day one and it was day two, not day three.
Most replies also missed two variables. News: a cannabis industry executive had joined a lobbying group, read as a push toward legalisation. And sector: ACB was clearly the strongest name in its group. With news and leadership, you can't simply call it overextended.
Finally, liquidity: a one-cent spread and about a million shares per two-minute bar (the same numbers from Lesson 2). Buying near $7.60 with a planned two-cent stop distance and a sixty-cent target gives a gross target-to-stop ratio of 30:1. This is neither expected return nor a guaranteed loss limit; spread, slippage, fees and the probability of reaching the target still matter. The verdict was good but not top tier, because the earlier pullback was deep and the base wasn't tight.
If you can't say why a rule exists, you'll miscount at its edges.
A year of doing one thing: marking the VWAP pullback
The futures trader from Lesson 4 treats building a playbook as a verb. For a full year after he moved to futures, he found the VWAP pullback in NQ or ES every day, marked up the chart, and circled the day's "easy money" trade.
Most days he never took it. He asked three questions: what does it look like, how did it form, and how could I have executed it? After enough of these, when he sees it live, a thought pops up: this goes that way seven or eight times out of ten.
That feeling came from a year of staring at the same chart, not from a book. More than five years in, he still journals and fills in scorecards daily. Between a definition and an instinct sit hundreds of marked-up charts. There's no shortcut. There's only marking up.
Shrinking the playbook to two layups
A veteran US equities day trader only hit his turning point in his third year. He described easy-money trades as layups and free throws: repeatable, with clearly defined risk, reliably worth a few hundred dollars.
He refined just two: mean reversion in certain tech stocks after violent opening moves, and mean reversion after a stock had run up for several days on euphoria. He grew size in those two and cut down on dumb mistakes, and his income started to climb fast.
Later he put the same idea in poker terms. A junior trader kept asking about marginal setups inside ranges, basically coin flips. His advice: stop studying how to play jack-five offsuit and focus on pocket pairs. Grinding range setups is stepping over a dollar on the floor to pick up a penny. The junior switched to breakouts into new price territory, and it saved his career, because most of his losses had come from inside ranges (Lesson 6 covers how to identify range conditions in which your particular setup has no demonstrated edge).
Writing down what you trade also crosses out a lot of what you don't. The shorter the playbook, the more work goes into each page.
Common mistakes
1. Adjectives instead of conditions. A "blow-off" with no reason given becomes "range and volume each at least double yesterday's." Fix: every adjective in an entry gets one question: which number or which candle? If you can't answer, that field is empty.
2. Casual lines as structure. Lines drawn straight through the middle of candles say nothing. Draw uptrend lines along the lows, using lows not closes; downtrend lines along the highs; throw a line away once it's pierced repeatedly. Fix: write down how lines are drawn and when they're void, or "trendline break" is a trigger you invent fresh every time.
3. News means focus. News is half of qualification. The other half is whether price and volume reacted. Fix: the reason-to-watch field needs both "cause" and "market reaction"; if the second is blank, the stock doesn't qualify.
4. Adding exceptions mid-session. The BPTH trade was the price of one. Fix: exception clauses are written only after the close and take effect the next day. "This time is different" goes in a notebook; decide after the close whether it earns a new version.
5. Calling every loss overtrading. Plenty of beginners do it in hindsight: winners were good trades, losers were automatically overtrading. Overtrading means not following the playbook you wrote in advance. Many people overtrade because they don't have one. Fix: entry first, then judge overtrading.
6. Adding a setup because someone else made money. One trader, five or six years in, got FOMO over a colleague's earnings plays, built a strategy that didn't fit him, and lost money and time. Fix: new setups go into an observation zone first. They need enough cut-off charts and a passed blind test before they enter the playbook proper.
Where this applies
This approach suits setups that recur and leave a continuous sample. Repeatable behaviour comes from specific market structure. A small cap that announces an offering and drops 20%, then fails to take out the prior candle's high on every bar for ten minutes or so, does that again and again. When structure backs a pattern, defining it means something.
One-off trades that can't be reproduced can have their process logged, but don't pretend they have stable statistics. With a small sample, changed structure or missing cost data, downgrade your conclusions.
A finished entry only earns the right to be tested. Whether it makes money is a question for the backtests and forward tests in Lessons 25 and 26.
Practice: the playbook admission hearing
Materials: collect 12 charts from one setup you study, each cut off at the candidate entry time. Include four provisional matches, four exclusions and four uncertain cases. A, B and C above are verbal illustrations, not supplied chart images.
Steps:
- Write all eight fields for your setup, plus version, sample window and cost assumptions.
- Turn every adjective into an observable condition. At least one exclusion must contain a number.
- Day one: judge all 12 charts as in / excluded / not enough information, and name the deciding field.
- Next day: shuffle and judge again.
- Find the charts you judged differently, change only the field that caused it, and bump the version. Don't delete ugly samples.
Scoring (14 points):
- 2: qualification and trigger are written as separate layers, and qualification includes both cause and market reaction.
- 4: all eight fields present, each backed by chart or background evidence available at entry time, no words like "strong" or "clean."
- 2: each counterexample names the exclusion that vetoed it.
- 2: neither blind pass peeked at what happened after entry.
- 2: borderline charts were marked "not enough information" instead of forced.
- 2: version, sample window and cost assumptions are traceable.
Keeping only winning charts, or adding exclusions after seeing outcomes, fails the exercise. In the verbal examples, A fails the lower-bounce-high condition and B fails the retracement limit; C meets the stated structure conditions only, not every admission requirement.
Log every sample under its version in the Trade Journal Analyzer, including the ones you skipped, so you can split them later.
Tools you can use
- Trade Journal Analyzer: log samples by entry and version, traded and skipped.
- Expectancy Calculator: once an entry has a continuous sample, compute its net expectancy.
How this connects
- Upstream: Lesson 4 turns opinions into testable hypotheses; this lesson turns a hypothesis into a recognisable entry.
- Downstream: Lesson 6 covers no-edge zones, the biggest category of exclusions; Lesson 10 refines trigger and invalidation into entry rules.
- Downstream: the scorecards in Lesson 24 and the backtests and forward tests in Lessons 25 and 26 all use this lesson's entry as the thing being tested.
Practice this lesson in NQ Replay
Take your written entry and exclusion rules into a replay session and log every time the setup appeared but an exclusion rule kept you out. NQ Replay is our own app for practicing on past NQ futures sessions, replayed tick by tick in simulation, with bracket orders, prop-style loss limits and per-trade review. You can request a free 7-day trial; you'll need your own licensed NQ tick data.
For educational purposes only. This is not financial advice and makes no promise of returns. Tickers, dates and market moves in real trade examples come from public sources. Individual P&L and record figures have been adjusted. Illustrative figures are the author's own. Trading involves risk of loss.
Test it in the calculator
Log every sample against its rule
Which version of your setup rule are you on, and how many consecutive samples sit under it?
Example: rule v2, 23 qualifying samples in the last two months, 15 of them actually traded.
Open the Trade Journal Analyzer