
In one line: context only tells you a trade is worth watching. The trigger tells you that you can act now. Invalidation tells you what proves you wrong. Write one line for each before you enter; if any is missing, don't trade.
Lesson 10 of the 30-part Trading Decisions course. By Eliza.
Lesson map
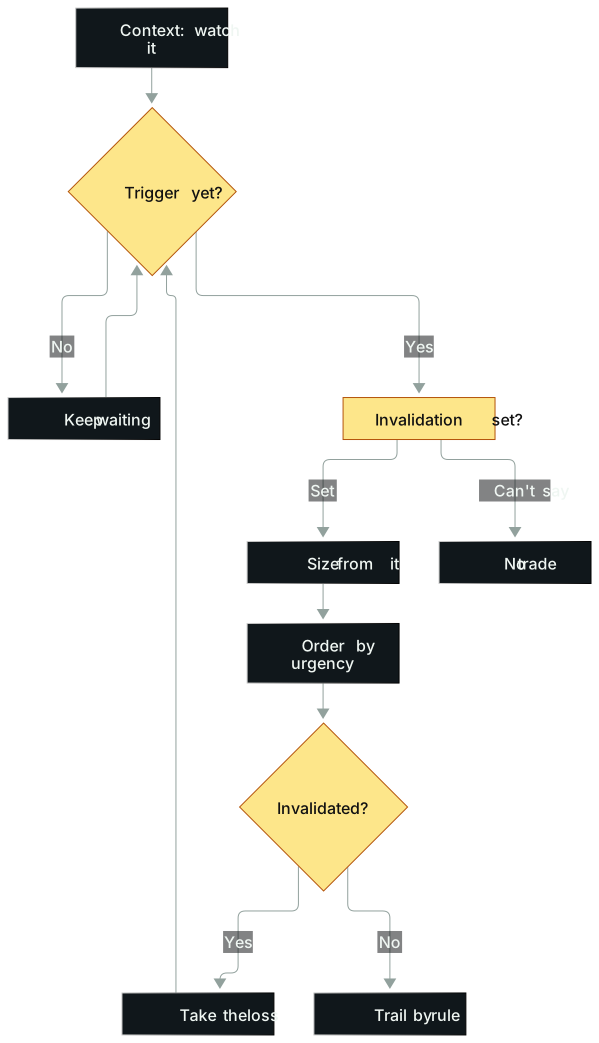
In words: Context puts a ticker on your radar. No trigger, you wait. A trigger appears, and you still ask whether invalidation is written down; if you can't say it, you don't trade. Invalidation sets the size. Once you're in, the only question is whether invalidation got hit: if yes, take the loss and go back to waiting; if not, trail by rule.
Opening: one night, two entries
Sunday, August 4, 2024. A veteran US equities day trader had just come off an exhausting weekend, an endurance race that same day, and almost didn't log in.
The context was set on Friday. Global markets closed weak after a violent selloff. The Bank of Japan had turned hawkish and hiked, the yen ripped higher as traders covered yen shorts, and the Nikkei had already dropped about 8% in the two sessions before the weekend. When futures opened Sunday night, the panic accelerated: down 3%, down 5%, down 10%. By Monday morning the index was down 12%, Japan's worst day since October 20, 1987, the Tokyo session after Black Monday in the US, when the Nikkei lost about 15%.
His whole posture changed. This was the kind of trade he'd spent a career training to wait for. The signs of a panic peak lined up: thin liquidity, wide spreads, circuit breakers in sight, mispricings between Nikkei futures, the yen and crypto. Three straight down days, enormous volume, a historic volatility spike. All of that was context. It answered "is this worth watching?" None of it answered "can I buy right now?"
His first entry came as the selloff sped toward a volatility halt. It looked like it was turning, so he bought the Nikkei in size. Slightly early. Price rolled over and headed back for the low, and he took the loss as planned.
Pause there. His thesis was that the panic had bottomed. Price going back to the low falsified it, so he got out.
Then a second signal. It could have broken down completely, and it didn't; price reclaimed the low. He knew this was the moment and built one of the largest positions of his career. The bounce came, hesitant and then violent. The sequence of lower highs and lower lows broke. Adding more meant waiting for a higher low. Price held higher, but not far from the bottom, and those 30 minutes felt like days. Once the higher low confirmed, he kept adding, and bought Nasdaq futures in size too, until the platform showed a message he'd almost never seen: order rejected, insufficient buying power.
Over the next few hours price drifted back toward the low. He'd been awake for well over twenty hours, drenched in sweat, and the only thing to lean on was the invalidation he'd already written: if it goes back to the low, I'm out, and I eat a very large loss. It didn't. The US opened and it kept climbing, open profit reached several million dollars and kept growing. His rule: stop starts at the day's low, then trails the prior daily bar's low. About a day later the overnight drop was fully recovered. He scaled out about three quarters, kept a quarter as a swing position until the prior day's low stopped it out, and called it the best trade of his career, a seven-figure win.
Nothing that night ran on feel. Context, first trigger and invalidation, second trigger, add trigger, preset invalidation, trailing stop: each step pointed at a price or a structure.
The idea
Three fields, none replaces another
Context answers "why is this worth watching?": a major catalyst, price near a daily high, three days of crashing, record volume. It decides what you watch, not when you press the key.
Trigger answers "why act now?" It must be an event you can see at the moment of entry: a break of the prior bar's high, an opening range break, a reclaim of a moving average, a higher low. "Feels like it's going up" doesn't count.
Invalidation answers "what market evidence proves my thesis wrong?" A good technical setup helps you mark a logical invalidation point, which in theory is where expected value flips negative. There's no reason to keep exposure after that.
How much you're willing to lose is a separate question. It sets size, it doesn't replace invalidation. A dollar-only stop disconnects the trade logic from the risk: your $500 might sit where price hasn't proven anything yet, or far past the point where it already has.
Same price, different expected value
This was the most important turn in that trader's career, and it's why triggers and context are kept apart.
Mid-career, already among the top performers at his firm, he kept bleeding on the left side of reversals, before the turn actually formed, sitting through big drawdowns. When price finally turned, his size or his head was in a bad spot and he ended up far smaller than he should have been. Lining up his worst trades side by side showed him the damage. He switched to waiting for the turn, buying the right side of the V. Being early pays nothing. Being right pays.
Poker makes it intuitive. A starting hand might win 40% of the time. After the flop, turn and river, the same hand might be 80%, or dead. In trading, every new bar updates the odds.
Our own numbers. Left side: the stock is still falling. Say a bounce back to normal is worth 30 cents, risk is 30 cents, win rate 57%, loss rate 43%. Expected value = 57% × 30 − 43% × 30 ≈ 4.2 cents a share. Slightly positive, and generous, because on the left side you often can't place a sensible stop at all.
Right side: wait for the turn, and the same price gains two things. The stop can sit at the day's low, so risk is defined. And you're trading with the new counter-trend, so the win rate rises. His experience was that the win-rate lift alone, at the same payoff, roughly quadruples expected value. Working backward from our assumption at 1:1, going from 4.2 cents to about 17 cents needs a win rate around 78%. Use it only for scale.
The usual objection: won't you get chopped up by small stops? If you do, your filter is too loose. This is for focus names in the most extreme setups only: the most volatile, the most panicked, several legs down. If buying the right side of any V on any stock worked, nobody in this business would lose money.
Aggressive vs. conservative: price vs. confirmation
An aggressive trigger comes earlier, at a better price, often with a tighter invalidation, and more false signals. A conservative trigger waits for more evidence, makes fewer mistakes, pays a worse price, and can miss a fast move. Both are valid. Both cost something.
The opening range breakout (ORB) is the classic case. The first 30 minutes or so is the market deciding whether price is too high, too low or about right; you trade the break. But ORBs aren't all the same mechanism: an exhaustion gap (a big gap up after days or weeks of rallying that breaks down through the range); day one after a major catalyst (institutions need days or weeks to build size, so the range is a launch pad); and the index range on a macro panic day (Lesson 7). Sandisk is one example: earnings after the close on April 30, a gap down the next day despite a big run, probing lower inside the range, then breaking up, and that break was the entry for the acceleration that followed.
The most common error is calling the top before the trend confirms, then racking up losses in a zone with no edge. A range break is a confirmation mechanism: you let price show you momentum is spent instead of guessing.
Three ways to write invalidation
A hard stop is a real order in the market. It takes the decision out of the moment, but it doesn't guarantee a maximum loss: stop-market orders can slip, and stop-limit orders may not fill. It can also shake you out of a still-valid trade during a brief imbalance. A mental stop relies on you, and plenty of people who claim to use mental stops simply have no stop.
A time stop asks something else. A price stop asks how much price pain you'll accept; a time stop asks how long you'll wait for the thesis to show up. One use: big breaking news, and the market still hasn't reacted after a few minutes, you usually leave without waiting for the price stop. The best trades tend to work right away.
The method
1. Four fields before the order
| Field | Answers | Written as |
|---|---|---|
| Context | Why watch it | Catalyst, location, regime, one or two lines |
| Trigger | Why act now | One event visible at entry |
| Invalidation | What proves me wrong | A price, a structure, or a time limit |
| Execution | How in, how out | Order type, size, exit method |
Cover the chart to the right and someone else should still be able to tell whether each condition has been met. Context doesn't fit in the trigger box, and the trigger doesn't fit in the invalidation box.
2. Pick a visible trigger
Common ones, each writable in a sentence:
- Break of the prior bar's high (long) or low (short). Good for a turn after a violent panic.
- Break of a tight downtrend line. If the trend is larger and looser, wait for a break above a moving average.
- Moving average flips from resistance to support. Price kept treating it as a ceiling; after a strong reversal bar it pushes through.
- Opening range break on a focus name. No catalyst and low volume, and the chop will beat you up.
- A higher low. After the panic peak, the pullback holds above the prior low.
Price is never the only input; volume, the daily picture and the tape all matter. But each one still has to be written as an event.
3. Set invalidation before entry
Three checks:
- Same timeframe. Daily logic, daily stop; intraday logic, intraday stop. The Nikkei trail used the prior daily low because it was a swing position (Lesson 8).
- You can say what's wrong if this level breaks. If you can't, it's just a comfortable number.
- Size comes from it. Wider invalidation, smaller size (Lesson 13).
4. Execute with an urgency scale
An order ladder, from most passive to most urgent: a limit bid below the market; stepping in front of the bid (best bid $50, you bid $50.07); lifting the offer, crossing the spread; a market order, where getting filled matters more than price. A strong long tape shows buyers repeatedly lifting offers, new bids stacking higher, dips bought fast. A weak one is the reverse: bids collapse, bounces fail.
Reading the tape usually has no edge. It helps only in active focus names at specific moments: a climax, a major breakout, major breaking news.
Strong and weak breakouts also show up in order behavior. A strong one has urgency and punches through the level. A weak one inches over, prints slow down, and sellers just above resistance hit the bid. Those tend to fail.
5. Hotkeys and alerts
Design hotkeys around two variables: how often you do the action, and how much speed matters. Frequent actions, like buying a standard unit a few cents over the offer, get the easiest combos. Rare but speed-critical actions, like flattening when news turns against you, need keys too. A few rules:
- Buy with the left hand, sell with the right;
- Ctrl combos close, Shift combos open;
- Max-size keys need two modifiers plus Enter; high-risk keys get a confirmation;
- Don't build it all at once: start with your 5 to 10 most common actions, use them for two weeks, then add;
- Test every change in a simulator first.
Hotkeys aren't there to make you more impulsive. Review your last two weeks first: where you hesitated, mis-clicked, or exited too slowly. Design for those specific errors.
One small habit: set alerts near the day's high and low on names you've traded, so you don't miss a second break later in the day.
More real cases
SMCI, February 16: context was the exhaustion gap, trigger was the third lower high
Friday, February 16, 2024. SMCI pushed higher at the open, then failed. That was an exhaustion gap, which is context: days and weeks of near-vertical gains, one more emotional push at the open, and the last buyers in holding the weakest hands.
Context said watch it for a short. It didn't say now. The structure came next: a big, violent flush, then a lower high, consolidation against support, more lower highs, then a break of that level. From memory, the trader put his entry around $860; the chart has since been split-adjusted, so the levels won't match. It's the most extreme version of Lesson 5's stair-step weak bounce.
The exit used the same simple system: mostly the high of the two-minute bar. Each new two-minute bar, the stop moved down to the prior bar's high. He covered near the lows. It was a Friday with same-day expiring options, and for asymmetry, skew and overall expected value it was one of the best single opportunities of the year. From another angle, the target could have been all the way back to the daily moving average, a long way off.
Watch where the trigger sits. You could already sense a possible reversal when the push failed. The entry was the break after a series of lower highs, not the failed push itself.
Tesla and DXYZ: writing "failure" in a text message
November 2024, the post-election run. Two nights in a row, Tesla was pushed to startling highs in the overnight session, and each time the overnight buyers got paid. Spotting that repetition is useful in itself.
On the night of November 11, Tesla pushed for new highs overnight again, around $366 to $367. The trader texted a few friends, roughly: if this overnight push fails and the open falls back into this range, the run is probably done.
Invalidation, written before the move, somewhere other people could see it. Overnight, price fell back below $360 and couldn't push again; after the regular-session open it weakened further, to around $328. Premarket had already broken the prior bar's low, the biggest change in days. DXYZ was his first choice, Tesla second, with Tesla's break point near $336. DXYZ couldn't get going premarket and opened below the prior day's low: the right side of the turn lower.
Respect the trend, then respect it again, then strike. Most people do the opposite: fight the whole way up, lose a lot, then give up just as the real break comes. The approach here: stay careful on the way up, don't front-run the short, write down what failure looks like, and attack when it shows up.
One tape detail from DXYZ that day: the whole bounce above $44 looked like one buyer. When Tesla broke out at 11, DXYZ should have followed and didn't, as if that buyer was done. It's a guess, like seeing the same graffiti tag all over town. Several relative-weakness signals together carry weight; any one alone doesn't.
Palantir, August 20: context on the daily, trigger intraday
Buying Palantir on August 20, 2025 was one of the best trades of that year. The context was daily: a gap up on August 5 after earnings released after the US close on August 4, then steady strength above the upper Bollinger Band. On a −10 to +10 pendulum scale, it went from about +6 to the lower band, about −8, in a few days, down nearly 20% in the last two sessions, for a huge, mature company. Sentiment had been hammered to an extreme.
The trigger was intraday. After days of free fall, it tried higher at the open, slid again, and treated the 20-period moving average (the Bollinger midline) as resistance. Then a strong green reversal bar, a break through the average, and the old trend was broken. That was the entry for size, alongside panic-level volume. Price then rode the average higher, recovered the drop, and eventually closed clearly back below it, a clean exit.
By the same logic, invalidation sits on the average too: if price can't hold and closes back under, the "resistance became support" thesis fails. That's inferred from the approach; no specific stop price was given. The bands aren't used to pick exact entry or exit prices on their own. They measure how far sentiment has stretched from balance, and working trades rely on several tools agreeing.
The silver flush: stopped out twice on small size
A small-cap short seller (we met him in Lesson 5) shows a sensible use of an aggressive trigger. On March 19, silver fell as much as 12%, SLV around 59 to 60. He went long early with small size and got stopped once or twice before the right side of the V formed. When it did, with price back over VWAP and through the 62 area that day, the move accelerated. The context, in hindsight: a high-volume flush, a higher low after the regular open, then liftoff.
He's never been a natural on the long side; this was learned. The upside of small test size is concrete: each stop costs a sliver, and you still have the right to a third entry. Go full size on the first try, get stopped twice, and you lack both the capital and the nerve to catch the move that matters.
The counter-example is GME on January 28, 2021 (Lesson 7): buying all the way down, averaging lower. Think it's overdone, buy at $210, and it drops another hundred points. Waiting for a counter-trend before entering cut severe drawdowns sharply.
Common mistakes
1. Entering on the catalyst or the level alone. Context isn't a trigger. Picture a run that fully retraces and pushes back to resistance. Getting in early is tempting, but that run just proved how weak it is, so even the breakout isn't worth taking. Fix: no trigger written, no trade.
2. Finding a stop after entry that fits the loss you can stomach. That stop is drawn from your loss budget, not from evidence. Fix: write invalidation on paper before entry. If you can't, you're not ready.
3. Treating every opening range break as one mechanism. A breakdown after an exhaustion gap, continuation after a catalyst, an index break on a panic day: different mechanisms, so don't pool the stats. Fix: tag each trade with its scenario in backtests and reviews.
4. Treating one big print on the tape as evidence. Spotting a single buyer is a guess. Fix: the tape confirms, it never triggers alone.
5. Missing a conservative trigger, then lowering the bar on the next one. Lesson 9's "A isn't B" again: missing the first doesn't give a later price the same expected value. Fix: set standards before entry, not after a miss.
6. Averaging down on the left side. Fix: wait for the first evidence of a counter-trend, then size up.
7. Testing new hotkeys live. Fix: simulator first, five actions for two weeks, then expand. Don't copy someone else's keys, share sizes or routing; their order flow isn't your account.
Where this applies
This framework fits short-term strategies whose triggers can be defined by pattern, time, prints or order behavior. In very illiquid names, around gap-risk news, with delayed data or shaky execution tools, even a perfect trigger may not fill as planned (Lesson 9).
Tape reading and hotkeys are execution. They don't turn a no-edge strategy into an edge; they just cut friction and fat fingers. The right side of the V is not universal either: it's for the most extreme cases only, and a loose filter means death by small stops.
Practice: blind replay with two triggers, plus fault injection
Material: 20 consecutive samples of one opening pattern from your own replays, with the future hidden. To warm up, split the Nikkei night into four fields: context, first trigger and invalidation, second trigger, add trigger and preset invalidation.
Steps:
- For each sample, pre-write two plans. Aggressive: enter on the first break of the range high on rising volume. Conservative: wait for a close above the range and a first retest that holds. Both get entry conditions and their own invalidation.
- Log entry, invalidation, max adverse move, slippage, and whether you missed. Log non-triggers too; no rewriting them later as "I would have taken it."
- In a simulator, inject five faults: wrong side, double press, partial fill, failed cancel, unfilled stop-limit. For each, write the detection signal, the immediate action and permission limits. If an emergency exit could itself add risk, say when you'd reduce, use a limit, or hard-stop.
- Build a trade-off table. Don't declare one trigger better forever.
Scoring (16 points):
- 2: context and trigger kept separate.
- 3: both triggers are events visible at entry.
- 3: each has its own invalidation on the decision timeframe.
- 2: consecutive samples, including non-triggers and failures.
- 2: slippage and costs included.
- 3: each of five faults has a detection signal and an action.
- 1: hotkeys not framed as strategy edge.
Reference: a passing conclusion reads roughly: aggressive gets better average prices with more false breaks; conservative misses some straight-line moves in exchange for fewer violations and less slippage; the choice depends on this sample and your execution. "Conservative is better," alone, scores zero.
Once your four fields are written, drop trigger, invalidation and target into the Risk/Reward Calculator to see if the trade is worth it, and use the Stop-Loss & Take-Profit Calculator when you need the actual order levels.
Tools you can use
- Risk/Reward Calculator: trigger to invalidation is risk, trigger to target is reward.
- Stop-Loss & Take-Profit Calculator: turn invalidation and target into order prices.
How this connects
- Upstream: Lesson 8's key levels feed context; Lesson 9's news and liquidity decide when, and with which orders, a trigger can be trusted.
- Downstream: Lesson 11 turns invalidation into a stop that isn't arbitrary; Lesson 12 covers scaling out; Lesson 13 sizes from the invalidation distance.
- Also: Lesson 22's single-trade review checks your four fields against "was there really a trigger?"
Practice this lesson in NQ Replay
A bracket order makes you enter the trigger and the invalidation price at the same time, which is this lesson's rule turned into a habit. NQ Replay is our own app for practicing on past NQ futures sessions, replayed tick by tick in simulation, with bracket orders, prop-style loss limits and per-trade review. You can request a free 7-day trial; you'll need your own licensed NQ tick data.
For educational purposes only. This is not financial advice and makes no promise of returns. Tickers, dates and market moves in real trade examples come from public sources. Individual P&L and record figures have been adjusted. Illustrative figures are the author's own. Trading involves risk of loss.
Test it in the calculator
Trigger and invalidation written? Check whether it pays
Trigger to invalidation is your risk, trigger to target is your reward. What's the ratio?
Example: trigger 25.40, invalidation 24.90, target 26.90: risk 0.50, reward 1.50, ratio 3:1.
Open the Risk/Reward Calculator