
In one line: higher timeframes tell you where price is and who may be in the trade. The lower timeframe decides whether you can act right now. Your stop follows the timeframe your entry was based on.
Lesson 8 of the 30-part Trading Decisions course. By Eliza.
Lesson map
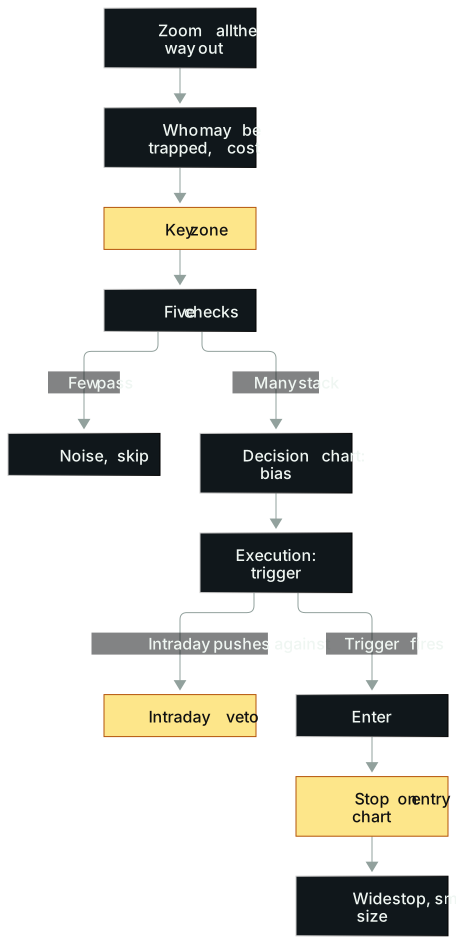
In words: Start on the widest chart: where heavy trading happened, and who may be in at what cost (a hypothesis, not a fact). Draw the key zone and run five checks. Only when several stack does the decision chart set a bias and the execution chart look for a trigger. The intraday chart can veto when it's pushing the other way. Once in, the stop sits on the timeframe you entered on, and a wider stop means smaller size.
Opening: one price, three crowds
Picture an unlabelled chart. On the daily there's a line that has capped price for a long time, close to its all-time high. One morning good news hits, and the stock gaps up to open just under that line. It doesn't rip. It dips first, then grinds back to the opening price, turns there and climbs back above the open. After that it's nearly a straight line.
That chart is SMCI on January 19, 2024. The company had put out an upbeat fiscal second-quarter update the day before (January 18), and the stock opened just under its prior record area (pre-split prices, around $355). Once it reclaimed the open, it ran hard for the rest of the day.
A veteran US equities day trader later used it to teach multiple timeframes. He counted crowds:
- Big news in a hot sector draws institutions, hedge funds and fundamental investors.
- A breakout to all-time highs after a long daily base draws swing traders.
- An intraday reclaim of the session open draws day traders.
His metaphor was war. A trade that only works on the 1-minute chart has a few scalpers on your side. The same pattern at a major daily level puts an army behind you. A small trader's only edge is speed: getting positioned before big money finishes building its stake.
There's a mirror image. Ford reported disappointing earnings after the close on October 26, 2023, and on October 27 the story was: losses in EVs, high costs in gas vehicles. Pre-market it was already below $11, a multi-year daily support. Intraday it formed the stair-step weak bounce from Lesson 5. All three timeframes pointed short, with the trigger a break of $10.20.
Same skeleton, opposite direction. The higher timeframe gives location ($355, $11), the news gives attention, and the intraday chart gives the moment you can act. With all three, the stop still hides behind the same key level; whether the extra reward is worth it is something your own samples have to show.
The idea
A line works because people stand behind it
Plenty of research says support and resistance don't work. That's partly right: backtest every horizontal line on random stocks and you may well get mostly noise.
When a line does work, the reason is plain. If a big seller keeps selling at the same price, price struggles to get through. Not because of a line on a chart, but because someone is actually selling there. Small traders see it stall and sell ahead of the big seller; the next one sells a bit lower. Over time a "resistance" grows on the chart. Charts don't predict. They record where others are likely to act.
Turnover can change what a price means. UNH had a high-volume panic on its daily chart where heavy volume may have moved shares from holders who bought near $500 to new owners with much lower costs. A chart can't confirm who sold, who still holds or at what cost, but if it did happen, the same price would feel very different to different holders: someone down 40% and someone up 10% could hit the sell button at very different speeds on the same bounce.
Every timeframe is a crowd
Scalpers watch 1- and 2-minute charts, intraday momentum traders 5 and 15 minutes, swing traders the daily, and institutions use the daily for the big picture. The more timeframes on which a level matters, the more people care about it.
Run it through expectancy. Alignment is a hypothesis to test, not a result: if timeframes agree, win rate and average win might both improve, or the extra conditions might just thin out your samples. Compare win rate, average win, average loss and costs with and without the overlap: E = p × average win − (1 − p) × average loss − costs.
The higher timeframe sets context, the lower one has a veto
This is the counter-intuitive one, and the veteran said it took years and a lot of tuition to absorb: however strongly the daily argues for a short, if the intraday chart keeps grinding higher, he almost never fights it. And when the daily is mediocre but the intraday is beautiful, he may still trade it.
The reason is that shorter timeframes sit closer to the order flow right now. However right your daily view, you only get paid once the market actually trades it.
He has put the intraday chart's weight at somewhere between 60% and 80% at different times, always calling it a rough guess. Don't fuss over the number. The structure holds: for day trades the intraday chart carries most of the weight; the longer the hold, the more it shifts to the daily.
Longer timeframes: more capacity, less precision
Switching timeframes costs something. Some very good opportunities live on the shortest timeframes, and the veteran leans on them. But a great trade that lasts minutes can only absorb so much size. Swing trades have time and liquidity to scale, at the cost of news, overnight gaps and other things you can't control between entry and exit.
So "moving to a bigger timeframe" isn't "moving to a better opportunity." It's a trade-off: precision for capacity.
The method
1. Run a key level through five checks
Before asking whether to buy or sell at a line, check five things:
- Is it in play? Unusual volume, unusual volatility, a major catalyst or an exceptional technical setup. On quiet names most levels are likely noise, and a level on its own may tell you little more than a coin flip.
- Is it clear? Another competent trader, pulling up the same chart without explanation, should find the same level. A line price keeps slicing through doesn't count.
- Was there a proper consolidation into it? Consolidation means the market is accepting the price. When price coils tight and won't pull back, both sides are pent up; on the break, covering shorts and new longs pile in together. In his experience it's the most underrated check in breakout trading.
- Has it caused a strong reaction before? Heavy volume, panicking shorts, eager longs and price leaving fast are evidence participants care about it.
- Do several timeframes point to the same price? He pointed to a gold intraday breakout that happened right at the prior day's high and then ran. One example proves nothing, but overlaps like this are worth checking, which is why he zooms out.
You don't need all five. Treat them as five things to record and test, not as a score that converts into a win probability. Even a full stack can fail.
When training new traders, he tested them with three hand-drawn breakouts. A: a good opening push, then a higher low, then another higher low, tightening, and a break up. B: a pullback too deep, a higher low then a lower low, a long way back to the breakout price. C: a slow grind up, price going up and down through the same level. He'd only take A. C beats B, but the level isn't clean enough to design a precise, profitable entry. In his view most people see one trade in all three and miss the nuance.
2. Read charts from far to near
The four charts on his screen haven't changed in over a decade. By importance:
| Chart | Indicators | Answers |
|---|---|---|
| 2-minute intraday | Volume, Bollinger Bands, VWAP | Is there a trigger now? |
| 3-month daily (sometimes 6) | Bollinger Bands, volume, 50-day MA | Recent strength, nearby gaps and key prices, how unusual today's volume is |
| Tick chart | Volume only | Is someone refilling at the same price? |
| 3-year daily | 200-day MA only | New IPO? Pending buyout? History of squeezes and odd gaps? |
That's the order of importance. The reading order runs the other way: zoom all the way out and ask who may be in and what they might have paid, then step in to the chart you trade from. Weights depend on context. On IPO day there's no daily, so it's almost all tape; for swings of days to weeks, the tape barely matters.
3. Use a strength scale, not magic ratios
Among the levels on common Fibonacci retracement tools, keep only the 50% midpoint (strictly it isn't a Fibonacci ratio), as the midpoint of a scale:
- A bounce after a drop: retracing 80% of the drop is strong, 20% is weak.
- A pullback after a breakout: giving back 20% is shallow and strong; 80% is deep and weak.
- The extremes are strong signals: a 100% retracement (a breakout fully failed, or a drop fully recovered) and 0% (no look back). In spring 2025 the market fully recovered its tariff losses and kept going; GLD broke a multi-year range and barely looked back.
The scale doesn't need decimals and works on any instrument and timeframe. A key level stops being a single line and becomes a ruler, so you always know which notch price is on.
4. Anchored VWAP is context, not a trigger
VWAP is the volume-weighted average traded price over a chosen window. A made-up example: 8,000 shares at $4.00, 6,000 at $4.50 and 16,000 at $5.00. Multiply, add, divide by total shares: about $4.63. Above it, price sits above today's volume-weighted average trade price; below it, under. Since it only reflects traded prices and volume, it can't tell you who still holds shares or what their costs are. Institutional execution algorithms use it as a key input, so it's partly self-fulfilling.
Regular VWAP resets daily. Anchored VWAP lets you pick the start: an earnings day, major news, a panic flush, a key breakout. This lesson's examples anchor to events; whether other anchors, such as calendar dates, suit you depends on your purpose and on testing.
There's one rule of thumb (Lesson 7 showed its regime use): the trader's filter was no shorts above VWAP unless there's a euphoric blow-off, and no longs below it unless there's an extreme panic flush. It is his filter, to be tested against your own strategy and market. Crossing the line is not an order. It only compares price with the average traded price since the anchor.
5. The stop follows the timeframe you entered on
Enter on the intraday chart, stop on the intraday chart; enter on the daily, stop on the daily. IonQ is an example: after a clean daily base it broke out above about $50. He bought on the daily, put the initial stop at that day's candle low, trailed with the prior daily candle's low, and held it up to about $71 (levels as he recalled them for teaching). No tight intraday stop.
A wider stop needs a smaller position. Triple the stop distance and size drops to roughly a third (Lesson 13 does the math).
More real cases
MULN: count who's trapped first
In July 2023, MULN rose nearly 70% in a day on perhaps the biggest volume in the market, over a billion shares. Breaking it down, the first chart wasn't the 2-minute. It was the three-year weekly: split-adjusted, the stock had been at $300, $350, $400. The one-year chart: $20–30. The two-month chart: around $1.40 and $1 a month or two earlier. This run started at about 12 cents.
The question was the old holders' psychology. Anyone holding from $300 was down 99.9%. Anyone from $20 was still down 99% even if the stock went from 12 to 25 cents. His reading was that such holders have little reason to sell at $1 or $2 and so there might be little urgent supply overhead. A chart can't prove who still holds or what they want, so treat that as a hypothesis to check with other evidence.
Here the long-term chart doesn't give an entry. It helps you form a hypothesis about whether anyone might be waiting to dump on you, and only zooming out lets you see the history behind it.
UNH: anchor to the most painful day
UnitedHealth was hammered by a string of bad news. The final blow came on May 15, 2025, with a criminal investigation into alleged Medicare fraud. That day brought rare, enormous volume and a panic drop, then a rebound from the intraday low, though it still closed roughly 11% below the prior close.
Anchor VWAP to that day and, at the time of his review (the date wasn't recorded, so treat it as a past observation), price had held above it. A swing long built on that idea still hadn't been stopped out then.
Why that day: huge turnover suggests a lot of shares changed hands, so many new holders may have bought around there. That is an inference: VWAP can't identify who still holds. Above the line, price is above the average traded price since that day; back below, that group may feel pressure. Anchor somewhere else and you are measuring something different.
TIGR: an A+ daily, a C intraday at best
In the 2024 China stimulus rally, TIGR was a trade the veteran made that year, mostly through options. But its intraday patterns were ugly; many stocks that year lacked clean intraday moves.
His answer was to change timeframe: build on the daily, lean on the highs, trail with the prior daily candle. He sold the calls into the heat in pieces; when the rally later collapsed, calls like those lost most of their value.
Sometimes the daily is an A+ and the intraday a B or C at best. The lesson: have a strategy that catches part of daily moves, without forcing overnight holds. This doesn't contradict the intraday veto. The intraday chart vetoes intraday trades; daily trades use daily triggers and daily stops, and the weights flip.
Micron: a breakout that gives back 200% isn't healthy
In 2024 Micron broke out of a balance area of about $125–130 and ran to about $160 (the June high), then fell much of the way back by late July and early August. Many asked whether it was a healthy pullback. Not at all.
Use the breakout leg as the ruler: taking $130 to $160 as a $30 leg, a 100% giveback (back to $130) means a failed breakout; down to $100 is a $60 drop, a 200% giveback, a panic flush. Anyone who bought at $160 could be down by half if it reached $80.
He put Micron near the top of his watchlist without predicting a Monday bounce. What he waited for was price deep into the 80s, a multi-year balance area. The case joins the strength scale with key levels: the scale says the breakout has fully failed, and the multi-year balance tells you the next place worth watching.
Common mistakes
1. More lines, more comfort. Rainbow charts with dozens of indicators are absurd. The veteran hasn't added an indicator in over a decade. A well-known momentum swing trader, asked why moving averages work, said he didn't know or care, and once ran the wrong settings on stream with almost no effect on his trading. The default 20-period is useful because it's where most people expect support. Fix: run a deletion test on every line. If removing it changes neither the entry reason nor the stop, it's decoration.
2. Treating a zone as an exact price. A stock runs from 150 to 250, and retail draws Fibonacci: 38.2% at 211.8, 50% at 200, 61.8% at 188.2, the "golden pocket." On the real chart, wicks keep slicing through these prices and you can't tell which candle only wicks and which keeps going. Fix: draw key levels as zones and put the stop outside, where the market has reacted before.
3. Fighting the lower timeframe with a higher-timeframe view. MSTR traded far above the value of its bitcoin holdings for a long time. Many fundamental analysts were sure the premium would close, shorting MSTR and buying bitcoin. Sentiment heated up, the premium widened, and some of them were forced out first. The premium later narrowed sharply, though the date and the way you measure net asset value matter. Price can stay away from fundamentals longer than a trader can stay solvent. Fix: the higher-timeframe view only chooses which direction to watch; pull the trigger on a lower-timeframe signal, and do nothing while it's pushing the other way.
4. Daily logic with a minute stop, or a minute trade held as a daily one. When the veteran first moved into swings, he bought a weekly breakout whose sensible daily stop was 8% below. The stock dipped 1.5% intraday, the 2-minute candles looked ugly, and he bailed. The real problem was size: the stop widened but the position didn't shrink, so it couldn't handle normal noise and forced a bad stop (Lesson 13). The reverse is more common: an intraday trade gets stopped, you tell yourself "the daily isn't broken," and it becomes a swing. Fix: write the entry timeframe down; technical invalidation should match that timeframe, and your preset risk limits and event exits still apply. Never switch timeframes to delay a stop.
5. Buying breakouts while the index sells off. In his experience, breakouts fail more often when the index is being dumped, however pretty the base, so he downgrades them: that alone can turn an A setup into a C or worse. For reversals after panic selling he gives the index less weight, since the opportunity comes from the stock's own imbalance. Fix: treat index direction as a veto for breakouts; for reversals it matters less to this trader, but market-wide stress still needs a look.
Where this applies
The framework fits trades with a clear holding period and a stop you can write down in advance. On quiet, illiquid names most levels are random, and the first check fails.
New IPOs have no daily chart, so there's nothing multi-timeframe about them; you read the tape and intraday.
Gaps on breaking news can invalidate stops on any timeframe. Levels say little then: size down, or wait for a new balance area before drawing lines.
The 60–80% intraday weight is a day trader's estimate. A swing trader who copies it will manage daily trades like day trades.
Practice: three-layer chart compression
Material: for round one, pull up the historical charts of these four cases yourself: SMCI (2024-01-19), Ford (2023-10-27), TIGR (2024 China rally), Micron (June to early August 2024). Pull up only the chart before the open or before the pullback, and hide what follows. Then pick 8 random days from your own instruments for 12 samples.
Steps:
- Keep three charts per sample: higher (3-month-plus daily or weekly), decision, execution. Mark at most three zones each.
- For each zone write its source (prior high, multi-year support, news-day anchored VWAP, etc.), how many of the five checks it passes, and how price approached it.
- Write the execution-chart trigger, invalidation, expected hold, and which timeframe the stop is on.
- Write one intraday veto: what execution-chart behaviour makes you pass however good the higher timeframe looks.
- Reveal the outcome and log it. No editing your marks.
- Run the deletion test and cross out lines that don't change the entry reason.
Scoring (12 points):
- 2: the higher timeframe lists only location and context (where heavy trading happened, who may be in), no entries.
- 2: evidence for each of the five checks; "looks nice" isn't evidence.
- 2: the trigger is visible price action, like reclaiming the open or breaking $10.20.
- 2: stop and hold time on the same timeframe, with how size shrinks when the stop widens.
- 2: among 12 samples, at least one "great higher timeframe, intraday veto, passed" and one taken-and-failed.
- 2: the deletion test removes at least one line, with why it looked useful.
Sample answer: SMCI: about $355–358 (pre-split) is the prior-high area on the daily, and the guidance update brought attention, so treat it as a candidate level; those facts alone don't prove the trade works. Wait for the post-open dip to finish and price to reclaim the open; it's void if price drops back under the open; stop and size are intraday. That would score well on the first four items if the supporting evidence is shown. "Every timeframe is strong, so buy" scores zero on trigger and invalidation. Drawing levels after the reveal zeroes that sample.
Once the stop is set, use the Stop-Loss & Take-Profit Calculator to pin down target and risk distance. When the zone is close and the target short, check whether it's worth taking with the Risk/Reward Calculator.
Tools you can use
- Stop-Loss & Take-Profit Calculator: risk and reward distances from a stop outside the zone and a target.
- Risk/Reward Calculator: compare reward-to-risk across several targets.
How this connects
- Upstream: Lesson 5's setup definitions say what you're looking for; Lesson 7's regime decides whether breakouts or reversals have the tailwind. This lesson adds "where" and "which timeframe decides."
- Downstream: Lesson 10's triggers and Lesson 11's stops use this lesson's execution timeframe and key zones; Lesson 13 sizes from the stop width set here.
- Parallel: Lesson 9 covers news and events; SMCI, Ford and UNH here are all cases where news brought attention to a key level.
Practice this lesson in NQ Replay
Mark your key levels before you press play, then slow the replay down and watch how price actually trades around them, tick by tick. NQ Replay is our own app for practicing on past NQ futures sessions, replayed tick by tick in simulation, with bracket orders, prop-style loss limits and per-trade review. You can request a free 7-day trial; you'll need your own licensed NQ tick data.
For educational purposes only. This is not financial advice and makes no promise of returns. Tickers, dates and market moves in real trade examples come from public sources. Individual P&L and record figures have been adjusted. Illustrative figures are the author's own. Trading involves risk of loss.
Test it in the calculator
Put the stop outside the zone
Where's the bottom of your key zone? With the stop just outside it, what are your target and reward-to-risk?
Example: buy at $40, zone floor $38.60, stop $38.40, first target $44: about 2.5 to 1.
Open the Stop-Loss & Take-Profit Calculator