
In one line: a no-edge zone isn't a place where price stands still. It's a place where you take lots of small losses, see few clean moves, and the small losses eat the nerve you need when the real opportunity shows up.
Lesson 6 of the 30-part Trading Decisions course. By Eliza.
Lesson map
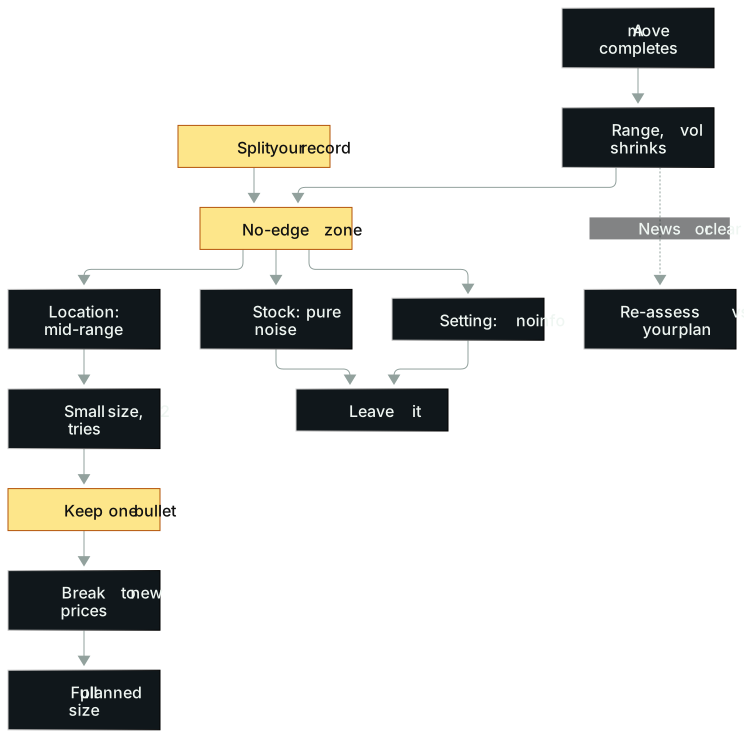
In words: (1) After a move, price settles into a range and volatility contracts. That is a no-edge zone. (2) It comes in three forms: location in the middle of a range, a noisy stock nobody watches, and a setting where you have no information. (3) Mid-range gets small size and two attempts at most, and you keep a bullet in reserve; noisy stocks and no-information settings you leave alone. (4) Real news or a clean price level is a reason to re-assess, not a green light: consider a trade only if a pre-defined plan, its entry conditions and its risk limit are all met. (5) The reserved bullet waits for a breakout into a new price area, then goes in at planned size. (6) All of this starts with splitting your own trades by inside vs outside the range.
Opening: 50 cents of risk, a whole morning of chop
On the morning of May 9, 2024, a trader got chopped up in GME for hours after the open. When the real breakout came, he was on the sidelines. He posted a review online, and someone replied that he'd been trading in a no-edge zone. He wrote back a long, thoughtful reply explaining why he likes to build positions early.
His reasoning held up. When he's confident in a big move, he almost always builds the breakout position during the consolidation, because after the breakout the risk distance grows almost fourfold and he can't size up. That day he bought the break of the opening-range high with a stop at the low of day: about 50 cents of risk, aiming for $20. Waiting for the real daily breakout and buying at $17.30–17.50 would have meant $1.50–2 of risk per share.
Without his fills, you can only infer from the numbers: a buy around $16.10, stopped out around 11:30. Break it into three layers.
Daily chart. GME firmed up from May 2, printed a big green candle on May 3, then a string of inside days, each within the prior day's range, forming a wedge. Low about $15.30, high about $17.25. Where is $16.10? It's 80 cents above the low and $1.15 below the high, about 41% of the way up. Support under a dollar away, resistance a bit over a dollar. Dead centre.
Intraday. The ideal intraday pattern is a day-long base that tightens and then snaps, letting you keep a very tight stop. But that day's equilibrium was around $16, the intraday breakout happened at $16.50–16.60, and by the time price reached the daily breakout level it had travelled far on a lot of volume. The pattern never formed.
Odds. The arithmetic was fine: buying around $16.10 with a $20 target means about $3.90 of upside per share against 50 cents of risk, roughly 7.8:1, and at that ratio you break even around an 11% win rate before fees and slippage. The win rate is the part nobody could pin down, and buying in the dead centre of a range drags it down. The ratio alone can't tell you whether the trade had positive expectancy.
The takeaway didn't judge the trade good or bad. It was about sizing: don't chop yourself out before the real breakout. Clean moves are unlikely there, so give yourself a few attempts and always keep one bullet in the chamber, so you're still in the game when it finally goes. Price did later reach $20, then reversed violently.
The odds were fine. The logic was fine. The location was the problem. In the wrong location, beautiful odds are just a lottery ticket with a big number printed on it.
The idea
What a no-edge zone looks like
The definition is short: the stock is stuck in a range, volatility keeps contracting, price chops back and forth in what is mostly noise, and the strategy you are using has no verified edge there after costs. Traders call it no man's land.
One sentence people skip: a no-edge zone is not a zone with zero opportunity. A clean move is much less likely there, and repeated small losses are much more likely. The term describes probability. Price still moves.
Two common shapes. One: a move in one direction, a move back, then chop with shrinking volatility. Two: a breakout that ran and is now digesting before the next leg. Both are "just finished a move, still digesting."
People who coach new traders tend to notice the same thing: most of a beginner's repeated small stops and pointless round trips happen in exactly these spots. That's an observation, not a statistic, but the direction is clear. Your small losses probably cluster in the same kind of place.
The second bill: small losses eat your nerve
The cost of a no-edge zone isn't just the stops. Picture a newer trader who spots a good stair-step weak bounce (from Lesson 5). Before price truly breaks the range, he shorts it twice and gets shaken out both times: say $800, then $1,200, $2,000 in total.
Later that day the stock does break down and leaves the range. He passes, for a simple reason: he doesn't want to lose again. The move plays out, and he misses roughly $3,000.
Two trades where there was no edge, one skipped where there was. Chop takes your money first, then takes your nerve right when the real setup arrives.
This is about the order in which you spend your risk budget. Your loss allowance, your attention and your willingness to take one more stop are all finite. Spend them on low-density chances and there's nothing left for the real one. Lesson 19 covers paying off that emotional bill. For now: the true cost of a no-edge zone includes what you missed afterwards.
Three kinds of no-edge places
"Mid-range" alone is too narrow. No edge shows up in at least three places.
Location: the middle of the range. GME above. Not close to support or resistance, no clear odds either way, every stop placement looks arbitrary.
Stock: noise nobody watches. Most of a prop firm's profit tends to come from a handful of opportunities each day, while on most other stocks most traders are just handing money back. There are thousands of US stocks. In the experience of people who have run trading floors, only a small number of names on a given day offer a real opportunity, and most of the profit comes from a few of them, month after month. That is a practitioner's observation, not a measured statistic. If all you trade is noise, you have nothing to stand on.
That's also the answer to "academics proved technical analysis doesn't work." Many studies test very simple rules on stocks no one is focused on, like trying a key in a door it was never cut for. A working hypothesis many traders hold is that chart-based setups do better under specific conditions, such as heavy volume, strong emotion and wide ranges, and that much of the rest is close to noise. Treat that as something to test on your own instruments and conditions, not a settled fact.
Setting: you have no information about what's happening. This one is the most expensive.
From December 2025 to January 2026, bitcoin traded between 80k and 100k dollars. Plenty of traders looked at that dull, narrow range, decided nothing could go wrong, and sold puts for premium. Then price broke the bottom of the range and fell more than $15,000. Selling options in a dull, compressed, low-implied-vol market is picking up pennies in front of a steamroller. Sooner or later, the steamroller arrives.
What the three share: you think you have an edge, when really nothing has gone wrong on the chart yet.
A setup's value depends on where it appears
Lesson 5 said the same setup can have wildly different expectancy in different locations. Here's a more basic variable: at entry, is price still inside the range, or breaking into new price territory?
Almost no traders split their trades on that variable. Here's a safe bet: most would be shocked comparing their in-range results with their results at new highs and lows.
The method
Split the record, then write rules
- Define your no-edge zone. How wide, how compressed, after what kind of move, in conditions you can point to on a chart.
- Sort your past trades into two piles. Entered while still inside the range, or while breaking into new price territory. Count, net P&L and average per trade for each, costs included.
- See how much you gave back in the range. This is the step that matters most.
- Write avoidance rules and practise spotting the zone live. In replay, pause regularly and say out loud: range or breakout?
- Keep collecting. Update both piles monthly and let the rules follow the data.
Two made-up ledgers. A trader makes $16,000 in a month on his best setup and loses $9,000 everywhere else. He doesn't need a new setup; he has a lead worth testing, one setup that has been working. The question is why he feels he has to take the others. Another: three clearly defined setups made $35,000 last quarter, and trades outside the playbook lost $14,000.
The answer may simply be to stop taking the junk trades. Keep the winning method, cut the losing pile, and profit changes.
Rules in three shapes
- Price hasn't left the range: half size, and no more than two attempts in that stock today.
- Right after a big flush: no chasing the short. Wait for a 30-minute base, then a break of the day's low.
- Continuation setups in the waist of the range: skip them all until price makes a new high of day.
They limit size and attempts, time, and location. For your own, pick one in each direction, each with a number or a price you can point to. "Don't mess around in ranges" isn't a rule.
Write exceptions, with sizes attached
Two exceptions hold up:
- Fresh breaking news. News can change the conditions, and once it hits, the old range may matter less. News is not an edge by itself, though. Only consider it if you have a pre-defined event plan with entry conditions and a risk limit, and all of them are met.
- A very clear support or resistance level inside the range. Call it a consolidation within the consolidation, an Inception-style dream inside a dream. It still works less often than a break of the whole range, so size down.
Both come with conditions and size limits. As Lesson 5 said, exceptions are written in advance. Ideas you have mid-session don't count.
If you must trade the range, save ammunition
The GME prescription is specific: small size, a fixed number of attempts, and enough risk budget left for the real breakout. Some traders look at a different structure: buying a call option for a fixed premium instead of trading stock with a 50-cent stop. That is a different trade with a different payoff, not a wider stop. Expiry, strike, time decay and implied volatility all matter, you can be right on direction and still lose, and the whole premium can go to zero. Evaluate it on its own terms if you consider it at all.
Doing nothing still has a task
Doing nothing doesn't mean leaving the process. While you wait, write down the one piece of information that would change your mind: a rejection at the range edge, a sudden volume surge, price reclaiming the pre-event reference, the news landing. If you can't name it, you're just staring at the screen, and staring has a way of renaming itself "observing."
This also separates disciplined waiting from skipping because you just lost. If a valid setup appears and you pass because you're scared, that's the bill from the last low-quality trade, not discipline.
More real cases
Both falling, only ARM is interesting
One day, put the ARM and Palantir daily charts side by side. ARM fell all day; Palantir barely moved. ARM was the one worth trading.
ARM had spent many months mostly around $60. Then came an earnings report after the close on February 7, 2024, an explosive move on February 8, followed by a euphoric blow-off that peaked on February 12. After that, Nvidia rallied more than 30% and SMCI made new highs, yet ARM couldn't go higher. Its highs kept stepping down, with a lower high near $150 and more after it, pressing toward a very clear support. Within its sector it was relatively weak.
Palantir had climbed steadily through most of 2023 and into 2024. It jumped on earnings with some follow-through, but there was no euphoric top and no exhaustion, just a steady rise, and at the time of this case it was back at the equilibrium of the previous few months. The consolidation was mostly noise with no tight, clear levels. You couldn't make the ARM argument for Palantir.
Both charts were "falling." ARM's fall came with an argument: exhaustion after euphoria, stepping lower highs, a clear support. Palantir's didn't, so it was a no-edge zone. A no-edge zone doesn't have to look messy. A stock in the middle of a decline can be one.
The ARM trade: short near $120, stop around the day's high at $122.60–122.70. Not earth-shattering, just an interesting daily setup.
Same tool, three places, three treatments
MACD. In a strong trend it helps you hold. In one directionless Tesla consolidation, though, the lines crossed back and forth around zero, every cross looked like a signal, and none produced a real move. Treat it as a buy/sell button and expectancy falls off a cliff.
Bollinger Bands. On November 21, 2024, MSTR offered a superb short: an upside exhaustion gap followed by a collapse. For the next few weeks, though, MSTR sat in the middle of its larger daily range, the bands narrowing and price wobbling around the average. That's when you mostly leave it alone, or trade far smaller than during the big opportunity. Same stock, great setup one month, no man's land the next.
Gold futures. Gold is fairly efficient most of the time and easy to skip. The trade worth taking came when two things lined up: dovish Fed comments gave a news catalyst, and gold broke cleanly out of a long consolidation. Simple systems shared online usually skip this part. When, and on which instruments, has to be written down precisely, and copycats rarely bother.
All three ask one question: what environment is this tool being used in right now?
Turtle soup: when price is accepted, take none
On long reversals, many traders like turtle soup: price breaks a support, then reclaims it. Picture three cases, A, B and C, all apparently the same trade.
At the bottoms of A and B, the candles get smaller and small dojis appear. When price is accepted like that, you can almost always file it as a pass. In B, price sits on support and can't bounce at all. What you want is different: heavy volume on the way down, an increasingly steep waterfall flush, and buyers scrambling to push price back. C gets more volatile as it falls; bounce attempts get swept, and there are no tiny compressed candles. Only C, and only on a high-volume flush, is worth considering.
Small dojis and shrinking candles are the language of a range. Accepted price means buyers and sellers agree on the price for now and nobody is in a hurry to go anywhere. When nobody's in a hurry, you don't get clean moves.
February 5, 2018: mistaking "no information" for "cheap"
This one happened outside any range, but the mistake is the same: treating a place where you have no information as a place where you have an edge.
On February 5, 2018, a veteran US equities day trader was six or seven years into his career. Near the close he was already up over $700,000 on a string of intraday trades, one of the best days he'd ever had. The market was falling hard, VIX was spiking, and people who had bet on volatility staying calm, using inverse-volatility exchange-traded notes, were scrambling for the exit, pushing VIX higher still.
After the close, those short-volatility products (XIV, an ETN giving daily inverse exposure to a VIX futures index, among them) began to collapse while the broader market barely moved. He didn't understand the move, saw it as a mean-reversion opportunity, and started buying. What he didn't know was how XIV's terms worked: if its intraday indicative value fell to a fifth or less of the prior day's closing indicative value, the issuer could redeem it early. The indicative value is not the same as the traded price. They kept falling, and within minutes his best day had turned into his worst, the loss far larger than the day's gains.
The danger of mean reversion is that the further a trade goes against you, the cheaper and more tempting it looks. Looking back, he was the least-informed side of that trade and didn't know what he was missing.
Compare GME: that trader knew exactly what he was doing; his location was just central. Here, the trader didn't even know how the product worked, yet acted decisively. Before asking whether you have an edge, ask whether you know the rules of the place.
Common mistakes
1. Thinking no edge means no movement. Ranges can break into huge moves at any moment; GME did go on to reach $20. No edge is about odds: few clean moves, many small losses. Fix: write down what counts as leaving the range, and once it breaks, use your planned size. Don't trade timidly because of earlier regret.
2. Trial and error mid-range with no budget left for the real break. The newer trader lost twice and missed the third. Veterans have made this mistake countless times too. Fix: at most two small attempts in the range, and always keep an untouched slice of the day's risk for the breakout.
3. Using great odds to excuse a bad location. 8:1 sounds strong, but nobody can pin down the win rate, especially mid-range. Fix: write odds and win rate separately. If you can't justify the win-rate line, trade small. Don't let the odds fill the blank.
4. Skipping the first valid trigger after two losses. That's the second bill. Fix: before each trade, check only whether the trigger is met, not how much you're down. Your daily limit manages losses, not your mood (Lesson 14).
5. Deciding on one dimension. Some traders short anything that's gone up a lot: shorting COIN didn't pay, shorting MSTR got them crushed, shorting PLTR didn't pay. DXYZ was the one worth shorting, because it had the biggest gain, sat 200% above its moving average, and had expanding range and volume all at once. To have an edge over the market, your analysis has to be finer than the market's. Fix: list at least three reasons for any trade, each visible on the chart.
6. Copying someone's system without its conditions. Like the gold example: ignore when and where it applies and there's no edge left. Fix: before copying, ask which instruments and which environment it's meant for, and whether that's written down. If not, assume it isn't there.
Where this applies
"No edge" is always relative to a method. A different method may have an edge in the same place.
On Facebook's IPO day, a veteran trader who has trained many newcomers made around $200,000 with market-making-style orders. The spread was over a dollar with enormous volume on both sides. He kept posting large bids and selling a dollar or two higher, again and again, before the spread narrowed and the stock started sliding, all in a few minutes. His edge came from understanding order types and queue priority, not from where price was going.
Ranges can hold other edges too, if a continuous sample proves it. A consolidation within a consolidation needs a very clear level and a size step down. No sample, no edge.
Also, intraday and swing ranges aren't the same thing. The middle of a 5-minute range might be the eve of a daily breakout. Name the timeframe of the range before deciding whether to avoid it.
Practice: the range hearing
Materials: this lesson's GME numbers plus ten replay clips of your own, picked at spots where you might once have jumped in.
Steps:
- GME warm-up. Daily low about $15.30, high about $17.25, buy at $16.10. How far is $16.10 from each, and what percentage of the range is that? Write down: if you had to take it, how many attempts, how big, and how much risk you'd keep for the real breakout. Then one sentence: what price action counts as the real breakout?
- Ten clips. Pause each at the moment you want in. Fill in: location in the range, volatility shrinking or expanding, any new information, higher and lower timeframes aligned or not, invalidation, and the next piece of information that would change your mind.
- Play on and classify. Still no opportunity; a valid trigger formed; it left without you.
- Count. How many "left without you" did you regret? Enough to change a rule? Only if a continuous sample supports a specific early-entry definition do you create a separate strategy. Don't write regret into the original rule.
- Optional: split the ledger. Sort last month's real trades into "in range" and "breaking to new prices" at entry, with count and net P&L for each.
Scoring (12 points):
- 3: all ten clips filled in before you knew the outcome.
- 2: each location and invalidation is specific and visible on the chart.
- 2: the waiting signals are observable, not "feels messy."
- 2: "left without you" kept as a sample, not counted as an error.
- 2: the GME answer includes attempts, size and reserved risk, all three.
- 1: one hypothesis you can test next round.
Reasons like "felt bad," or anything rewritten after seeing the outcome, score zero.
Answer to step 1: 16.10 − 15.30 = 0.80; 17.25 − 16.10 = 1.15; range width 1.95; 0.80 ÷ 1.95 ≈ 41%.
Check the odds and breakeven win rate with the Risk/Reward Calculator. On high-fee instruments, the Break-Even After Fees Calculator gives the price move needed to cover fees; compare it with your planned stop distance.
Tools you can use
- Risk/Reward Calculator: reward-to-risk and the win rate you need to break even.
- Break-Even After Fees Calculator: the price move needed to cover buy and sell fees, to compare with a small stop.
How this connects
- Upstream: Lesson 5's exclusions. No-edge zones are the biggest category; this lesson shows how to spot them.
- Downstream: Lesson 7 places this lesson's "range" in a broader regime map; Lesson 10 turns "breaking into new price territory" into an executable trigger.
- Side links: Lesson 13 on sizing and Lesson 14 on daily limits put numbers on "trade small, keep a bullet"; Lesson 19 covers how small losses change decisions.
Practice this lesson in NQ Replay
Jump to the open or to a news time and practice keeping your hands off the mouse through the zones you marked as no-edge. NQ Replay is our own app for practicing on past NQ futures sessions, replayed tick by tick in simulation, with bracket orders, prop-style loss limits and per-trade review. You can request a free 7-day trial; you'll need your own licensed NQ tick data.
For educational purposes only. This is not financial advice and makes no promise of returns. Tickers, dates and market moves in real trade examples come from public sources. Individual P&L and record figures have been adjusted. Illustrative figures are the author's own. Trading involves risk of loss.
Test it in the calculator
Nice odds? Check the location first
What is the reward-to-risk on this trade, and do you have any basis for your win-rate estimate?
Example: $0.50 stop, about $3.90 to the target, roughly 8:1 reward-to-risk, breakeven at about an 11% win rate before costs.
Open the Risk/Reward Calculator