
In one line: let the way a trade makes money choose the exit. Reversion pays at the target; trends get a trailing stop; a trade that should have paid by now gets cut. Write all three down before you enter.
Lesson 12 of the 30-part Trading Decisions course. By Eliza.
Lesson map
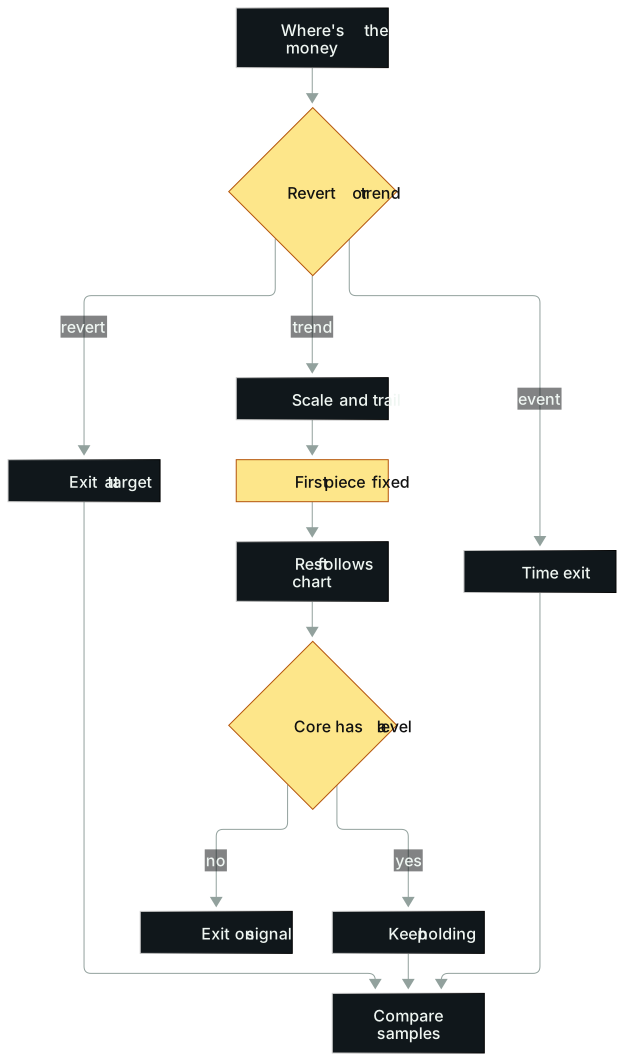
In words: Start with where the money comes from. Reversion gets a target, a trend gets scaled out and trailed, an event gets a deadline. Fix the size of the first piece in advance and let the rest follow structure. A core position needs a price that would prove it wrong; without one, exit on the signal. Then compare all three rules on consecutive samples.
Opening: the last small piece of a short
In 2024 a veteran US equities day trader went after DXYZ, a closed-end fund holding stakes in private tech companies and trading far above its net asset value. He started shorting near $47 and kept adding until he had a large swing short, roughly 70,000 shares.
The first half went cleanly. As price fell he covered some along the way; when price broke the prior bar's high, he covered a big chunk. Every step followed his rules, and the trade was solidly green.
The trouble was the small piece he kept.
He had a reason, and he believed it: a fund with a premium that rich would issue more shares sooner or later. He wanted a core short he could live with, using roughly $50 as a line in the sand. Then price broke the prior bar's high again. By his own rules that was a cover signal. He didn't act, half-telling himself it might be a fakeout.
He covered the rest later. A very good profit was nearly erased; on this name the trade may even have ended red. He ranked it his second-biggest loss of the year, and his review fit in one sentence: he should have listened to the chart.
Around the same time he kept a core short in another stock, with the opposite result. Circle topped on June 23, 2025. He expected it to fall hard by year-end and held a core short through the rest of the year, covering a bit on the way down and re-adding on bounces. When it broke below $110 in November he pressed hard. It may have been his best stock of the year.
Both were "core positions." The difference can be written down: the Circle core moved with price, while the last DXYZ piece was defending a story after price had already given the cover signal. The sources don't say what stop rule he used on Circle, so we won't invent one.
This lesson is about that half of the trade: once you're in, how the money comes back out.
The idea
The bigger the open profit, the lower the expectancy
Some quick arithmetic, with our own numbers. Entry $50, stop $49.20, risk $0.80 a share. Price runs to $52. If the stop is still at $49.20, holding now means risking a $2.80 giveback. You entered risking 0.80 for more; now you risk 2.80 for whatever upside is left. The further price goes, the less room is left above and the further away the stop sits. As a trade moves your way, its expectancy is usually falling.
The reverse also holds. Expectancy peaks at the moment the conditions line up for entry. When expectancy is highest, size should be largest; as it falls, size should shrink; at zero, you shouldn't hold anything. That logic works for entries and it works just as well for exits. Scaling out is how you let size follow expectancy down. Open profit isn't a bonus. It's the new cost of staying in the market.
Four exits, four questions
Target exit: where was the money supposed to come from, and are we there? A mean-reversion trade gets paid when price returns to balance, so the target is written before entry. When shorting the SMCI exhaustion gap on February 16, 2024 (entry covered in Lesson 10), the reversal's target could sit all the way back at the daily moving average, a very long way off. A target isn't a number you pull from the air. It answers how much this trade can make at most.
Partial exit: what to do when two ideas collide. One voice wants to bank it; the other thinks the trend has a long way to go. Scaling out settles the argument: part comes off, part stays. It isn't a consolation prize. Each piece's size and trigger are written down in advance.
Trailing stop: let the market say when the trend is over. It only moves in your favor and is never widened. Trendlines work for this because as price moves with you, the stop moves too, protecting open profit. Flat support and resistance don't do that. Many trend traders default to trailing the prior bar's low or high.
Time exit: how long am I willing to wait? Lesson 10 separated time stops from price stops. Here's the management angle: good trades often work right away. A trade that sits there should get smaller as time passes, and if it still hasn't moved by the deadline, cut it. An intraday deadline might be ten minutes; a daily one might be three days. Each comes from its own sample.
Match the timeframe and the tool
Exit on the timeframe you entered on. The IonQ daily breakout trailed the prior daily low and rode to about $71 (the stop side is in Lesson 11).
How tight the tool is depends on how fast the stock moves. One daily momentum swing trader runs a clear set of rules: buy the opening-range high on a breakout, stop at that day's low; after a few days, about three to five sessions, sell a third to a half and move the stop to breakeven; then trail the 10-day moving average and sell on the first close below it. Fast names get the 10-day, slower ones the 20-day. Nvidia went a long stretch after March 23, 2023 without a single close under its 20-day. It poked through intraday a few times and never closed below.
Compared with a short-term trader, the difference is the final step. The swing trader exits only on a close below; the short-term trader, on a shorter clock, often exits on the first break. Chasing big daily trends, loosening the exit condition for longer holds is a fair trade for him. The steeper the run, the deeper the pullbacks tend to be, so use a faster, tighter average; the steadier the trend, the more room the stop gets.
Why do moving averages work? One explanation: they measure the balance price, so holding above means the trend still has speed and breaking below means it's slowing. The swing trader himself says he isn't sure why it works and doesn't much care; he treats it as a market behavior that has persisted for decades. Averages fail in choppy ranges. Use them on names that trend.
The method: five things to write before entry
- Where the money comes from. Reversion, trend or event. If you can't pick one, your exit rule has no basis.
- Where the first piece goes, and how big. Define the level by structure or R multiple (R is defined in Lesson 2) and fix the size. The swing trader above uses a third to a half. Everyone's ratio comes from their own sample, so don't treat it as universal.
- What the rest follows. Prior bar's low or the 20-day; a close below or a touch; which timeframe's close.
- What happens if it hasn't paid by the deadline. Set a time limit and reduce or exit when it hits. Ten minutes without follow-through intraday and three days without follow-through on a daily chart are two different rules.
- Why a core position stays. It has to be something price can test, with a level that proves it wrong. That's exactly where the DXYZ piece failed.
On breakeven stops. The swing trader moves to breakeven only after a few days and after the first sale, and he chose that from his own data. Jumping the stop to entry the moment price allows is mostly about comfort, and it changes the whole distribution: trades that would have survived a normal retest now get shaken out. Let data decide (see the practice).
Don't choose a rule by its best trade. Compare exits on the same consecutive entries, looking at net expectancy, max drawdown, profit skew, average hold time, slippage and capital tied up. Compare only total profit and you'll pick a rule propped up by one or two outliers. Compare only win rate and you'll drift toward cashing out early.
Buying power is an exit variable too. Open profit grows your equity, and the extra room can buy strong names that haven't moved yet. Holding a mediocre position means passing on new opportunities. Whether to keep it depends on its remaining expectancy from here, not on your entry price.
Holding overnight is an exit decision. Figma listed on July 31, 2025, priced at $33 and opening at $85. Going long on the breakout above $112.50 and seeing it still strong into the close, the trader chose to hold into the after-hours session for overnight momentum. It worked; no P&L was given. The conditions were a hot sector, a tight float and a bullish market. Hold overnight for reasons like those, not because deciding felt like work.
More real cases
The other half of the Nikkei night: most of it comes off first
Lesson 10 covered the entry on the Nikkei on the night of August 4, 2024. This is just the exit.
Soon after he built the position the open profit was large; then price turned and the profit went as fast as it came, back toward the low. He did what the system said: back at the low, he'd be out. Then US traders woke up, buyers showed, and price held at a higher level. At the US open the Nasdaq held above its low and climbed, and he used the new buying power on names from his watchlist that hadn't moved yet: Nvidia, Apple, Bank of America. Open profit reached several million dollars and kept growing.
By then the stop, close at entry, still sat at the day's low, and the overnight panic drop had been recovered within a day. Holding the full position meant a growing giveback risk for a shrinking amount of remaining room. So he scaled out in big pieces and locked in roughly three quarters of the profit in that stretch. He kept the remaining quarter as a multi-day swing, trailing the prior daily low. The Nikkei, Nasdaq, Apple, Nvidia and Bank of America all recovered several days of losses before the swing piece was stopped out.
One easy-to-miss detail: after August 5, everything held on a trailing stop worked beautifully, but he didn't hold well himself. He had other work on a deadline and wanted to close early to free up his attention. He later counted that as one of the most expensive tradeoffs of his year.
All three exits showed up that night. The initial stop at the day's low was the "I'm wrong" exit. The big partials were the "cut exposure after getting paid" exit. The core trailing the prior daily low was the "let the trend announce its own end" exit. Each handled one stretch, and none relied on feel.
MULN: a target is a plan, and plans change with evidence
On July 6, 2023, a review walked through MULN, a penny stock, over two sessions. The day before, it had gained almost 70% and closed strong, which made it an overnight setup: who wants to sell at 16 or 17 cents? The morning plan was to buy at 17 cents; a few weeks earlier the stock was between $1 and $1.50, so selling at 22 cents and paying commissions wasn't very interesting. The levels of interest were 25, 30, 35 and 40 cents, ideally holding some for 50 cents to $1.
At 8 a.m. the company put out another release authorizing a buyback. The first move was to check how big it was relative to the float, because a buyback takes cash, and a company this close to bankruptcy has to get it from somewhere. Volume poured in around 8:15, and the plan then was to add rather than stand against the volume. Thirty cents was the first zone to consider selling.
After the open it pushed to 30 cents on good volume, couldn't hold and dropped. A failed push means your read of the odds should change. The short case started to make sense too: the company issued shares often, authorizing a buyback isn't the same as doing one, and the price had doubled off the low. As it formed a lower high near the prior high, starting to sell, or at least trim, was reasonable. The post-open range was about 7 cents wide, a lot in percentage terms for this stock and meaningful at size. When support broke, that level was both the long exit and the short entry.
This review is about thinking, not a fill log, so don't use it to reconcile anything. Take the sequence: the plan to hold some for 50 cents to $1 was rewritten by the failed breakout at 30 cents. While the evidence holds, a target is a plan. Once the evidence changes, it stops being a promise.
Trendlines: the stop travels with the trend
A Dow futures trader went short with an initial stop at 43,719, which by her quote meant about $40 of risk. Price walked down a falling trendline, she moved the stop down along it by hand to 43,358, and exited on the trendline break for about $100. (The sources don't give the contract spec, so the dollar figures are her quotes and aren't converted to points.)
Two points. First, the trailing stop protects open profit. Second, it comes with a clean exit rule: take profit on the trendline break. Many beginners want exactly that kind of "if X, then Y" rule, and classic support and resistance breaks rarely give one for the profit side. It also implies a default: don't buy right above a falling trendline, because your stop keeps sliding down and the worse the trade goes, the more you're risking. Simple doesn't mean useless.
NIO and Nvidia: same ruler, different marks
NIO moved fast and got the 10-day; Nvidia moved slower and got the 20-day, which it didn't close below for that whole stretch. Trailing parameters aren't better tighter or better looser. They have to match the rhythm of the thing you're holding.
Common mistakes
1. Changing the partial size based on how much you're up. Up a lot, you want to keep more; up a little, you want to sell it all. Mood-driven ratios mix several rules into one record and wreck the stats. Fix: write size and trigger before entry; to change them, test a new version separately.
2. The reason for the core is a story. The DXYZ reason was "they'll issue shares eventually." Maybe true, but it has no invalidation; no price path can disprove it. Fix: a core reason must include a price level, and the position goes when price gets there.
3. Not sitting tight, or letting go because of something else. An old speculator's line holds that the big money was never in the thinking but in the sitting. Sitting costs attention, sleep and calendar. Fix: if you won't be watching, put the trailing stop in as a live order instead of relying on memory; on a gap it can still fill worse than the stop price.
4. Moving to breakeven automatically at entry price. Breakeven is a decision that changes your distribution, not a safety blanket. Fix: test "breakeven after the first sale" against "breakeven at 1R" on the same samples.
5. Using one big move to prove a rule. The Nikkei trade looks great, but one trade can't prove the prior daily low beats the 20-day. Fix: run each rule on the same consecutive samples.
6. Only asking which rule made more. The highest-profit rule is often carried by the top 10% of trades. Fix: look at drawdown, worst streak and how much the top 10% contribute.
Where this applies
- Thin order books, wide slippage or unsplittable minimum units make partials more expensive. One contract can't be sold in three pieces.
- Option exits depend on time value and implied volatility; the stock's target price isn't the contract's target.
- Ahead of major events, tail risk may force you to cut exposure before any rule triggers.
- Overnight holds need gaps and capital usage priced in. A ten-minute intraday rule moved to daily charts is a different strategy.
- Different mechanisms don't share rules. A reversion trade on a trend-style trailing stop gets washed out by normal pullbacks.
The same holds in FX and CFDs. Lot sizes split finely, so scaling out is easy. The hard part is that spreads widen outside the main sessions, and a stop moved to breakeven too early can be taken out by a single spread spike.
Practice: the three-track exit experiment
Material one, outcome hidden: the Nikkei trade. Use only what was known from the evening of August 4 to the US open on August 5: panic accelerating, a higher low forming, open profit at several million dollars and still growing. Write your partial size, the trailing rule for the rest, and one sentence on what your rule does if price falls back to the low. Then compare: roughly three quarters locked first, the last quarter trailing the prior daily low.
Material two, your own sample: pick 30 consecutive entries of one type. Freeze the entries and replay three rules: exit everything at a fixed 1.5R; take half at +1R and trail the rest by structure; exit if there's no follow-through within a set time. For each, record net R, max drawdown, worst streak, average hold, the top 10%'s contribution and costs. Finish with a 200-word rationale tying the chosen exit to how the strategy makes money.
Scoring (15 points):
- 3: the 30 samples are identical across rules and consecutive.
- 3: all three rules written before testing, no picking highs after the fact.
- 3: compares return, drawdown, skew, hold time and cost together.
- 2: explains how outliers affect the conclusion.
- 2: the rationale ties back to the entry mechanism.
- 2: names where it fails and how the next forward test will run.
Reference: a passing conclusion reads roughly: in this sample, half-plus-trail had slightly lower net R than fixed 1.5R, but a clearly better worst streak and less reliance on the top 10%; the strategy makes money from trend continuation, so choose it and forward-test 20 more trades. Reporting only which rule made the most, or mixing several rules inside one trade, fails.
Work out where the first piece goes and where the stop on the rest moves in R multiples with the Stop-Loss & Take-Profit Calculator, and compare returns across targets with the Risk-Reward Calculator. For FX, PipGauge's Partial Exit Planner lays out the lots and price for each piece.
Tools you can use
- Stop-Loss & Take-Profit Calculator: set the first target and the stop on the rest in R.
- Risk-Reward Calculator: compare payoffs across targets.
- Partial Exit Planner (PipGauge): lots and prices for each piece in FX and CFDs.
How this connects
- Upstream: Lesson 10 gives the trigger, Lesson 11 the stop level; this lesson covers managing the trade after entry.
- Downstream: Lesson 13 covers size, and the right size is what lets you sit through a trailing stop; Lesson 15 covers adding and cutting, and scaling out is one form of cutting.
- Alongside: Lessons 20 and 21 cover attention and sitting out, where the cost of closing the Nikkei swing early gets settled.
Practice this lesson in NQ Replay
ATM templates support up to three targets, automatic breakeven and a trailing stop, so you can compare exit plans on the same kind of setup. NQ Replay is our own app for practicing on past NQ futures sessions, replayed tick by tick in simulation, with bracket orders, prop-style loss limits and per-trade review. You can request a free 7-day trial; you'll need your own licensed NQ tick data.
For educational purposes only. This is not financial advice and makes no promise of returns. Tickers, dates and market moves in real trade examples come from public sources. Individual P&L and record figures have been adjusted. Illustrative figures are the author's own. Trading involves risk of loss.
Test it in the calculator
Work out where the first piece goes
Set the first target in R multiples. Where does the stop on the rest move to?
Example: entry 50.00, stop 49.20, 1R = 0.80. First target +1.5R = 51.20, sell half, move the stop on the rest to 50.00.
Open the Stop-Loss & Take-Profit Calculator