
The short version: decide what you lose if you're wrong, call it 1R, and measure every result in units of that number. Only then can trades in different markets, at different prices and in different accounts sit in the same table.
Lesson 2 of the 30-part Trading Decisions course. By Eliza.
How this lesson fits together
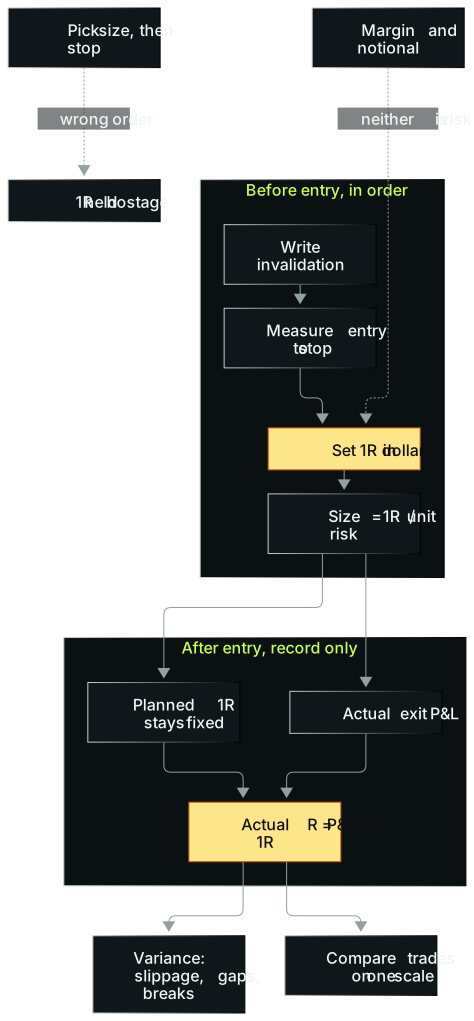
In words: (1) Before entry, four steps in order: write the invalidation, measure the distance from entry to invalidation, set the dollar amount of 1R, and divide 1R by risk per unit to get size. (2) After entry you only record: planned 1R stays fixed, and actual P&L divided by 1R gives the actual R. (3) Actual R feeds a variance column (slippage, gaps, rule breaks) and lets different trades be compared on one scale. (4) Two common ways to go wrong: picking size first and then hunting for a stop, which lets size hijack 1R; and treating margin or notional value as risk, which neither is.
The review that said 1:7
A trader turned in a day review. The stock was a growth name that had sold off after earnings the night before. His read: the selloff was shaking out weak hands. After the open, price bounced off the lows, broke the high of day, fell back into the range to clear out a round of stops, then found buyers around VWAP. When the bid showed up he got in, and the stock took off.
The line that jumped out of the review: his stop got tested to the penny, and the tight stop gave him close to a 1:7 risk-to-reward. He graded his day a B.
Whoever reads a review like this should praise the detail, then ask three questions. What percentage of these trades work? Was the size right? And the feeling that "today could be a big day," is there any data behind it?
All three questions circle the same point. A 1:7 on its own tells you very little.
A stop tested to the penny means price came back, tagged the stop level and left. So 1R was the small gap between entry and that stop. Put the stop twice as far away and the dollars made don't change at all, but the reward-to-risk drops from 7 to 3.5. The same profit can be a big R or a modest R depending on how tight you set 1R in advance.
The trader's own fix at the bottom of the review says the same thing. Make stop placement systematic: instead of "somewhere under VWAP," use the low of the entry candle. Then every trade's 1R is measured by the same rule, not by feel.
The ideas
1R is a dollar amount you set before entry
1R is the money you're willing to lose if this trade is wrong. It isn't one contract, one share, or a percentage of your account, though you can use a percentage to set it.
A simple sample: breakout at $218, breakout candle low at $215, stop at $215. That's $3 of risk per share, and that $3 is this trade's per-share 1R (Lesson 3 works through the full sample). Price later ran to $221 and the trade was closed when it settled below the 10-period moving average. That's $3 above entry, so +1R.
Swing traders often frame it the other way around: how many dollars am I putting at risk here, say $9,000? Then they check what share of the account the position is, against a ceiling. Same idea either way. 1R is an amount. You set the amount first, and the share count follows.
Why R and not dollars
Two trades. One made $300, the other made $3,000. Which was better?
You can't say. If the first one risked $60, it's +5R. If the second one risked $1,500, it's +2R. The smaller win did more with the risk it took.
There's a scene that plays out in every prop room. A junior trader executes a trade exactly as well as a senior one. The junior makes $300, the senior makes $3,000 or $30,000. The only difference is an extra zero on the share size, which becomes an extra zero on the P&L. In R, both trades are the same number. The dollars differ by 10x or 100x and the skill doesn't differ at all. Capital doesn't create opportunity. Skill does, and capital amplifies it. R strips away the amplifier so you can look at the skill.
So R does three jobs:
- Different dollar amounts become comparable. Small account, big account, yesterday's starter size and today's full size all go in one column.
- Different instruments become comparable. One point in NQ and one cent in a $7 stock live on completely different scales. In R, both are "lost so many 1Rs."
- Different stop widths become comparable. Tight stop or wide stop, each trade carries the same risk, so the R earned actually means something.
Notional, margin and risk are three different numbers
New traders mix these up constantly.
- Notional value: the total market value of the position. 6,000 shares at $7.60 is about $45,600.
- Margin: what the broker makes you post. It decides whether you can open the position, not how much you can lose.
- Planned risk: distance from entry to invalidation times quantity. That's 1R.
Take a real ACB breakout. The stock had a one-cent spread and traded roughly a million shares per two-minute bar. With that kind of liquidity, a two-cent stop was realistic. Risk two cents to make sixty is 30 to 1.
Set 1R at $120 and the size is 120 ÷ 0.02 = 6,000 shares. Bought at $7.60, notional is about $45,600 and planned risk is $120. Same order, two numbers 380 times apart. Treat notional as risk and $45,600 scares you off the trade. Treat planned risk as notional and you think the trade is too small to matter.
Planned R and actual R are two separate books
The 1R you set before entry is planned R. Actual P&L divided by 1R after the exit is actual R. If they differ, record where the gap came from.
A stop order doesn't promise a fill at your price. Gaps, halts, fast markets and vanishing liquidity can all push the real loss past 1R.
Run a hypothetical. Entry $64, stop $61.50, so 1R is $2.50 a share. Bad news hits overnight and the stock opens at $55. You lose $9 a share, which is −3.6R. That −3.6R does not get rounded to −1R. Round it off and you'll never learn whether your stops hold up in a real tail event.
Keeping two books gives stop failure a place to show up. Once you can tag it as slippage, gap, rule break or no fill, you can actually do something about it.
The method: size with R, then measure with R
Five steps, in this order
- Write the invalidation. Where is this idea proven wrong? Say it as a price, not a feeling.
- Measure the distance. From entry to invalidation, per share (or per contract, per tick).
- Set 1R in money. Fixed dollars or a percentage of the account both work. Dollars are concrete. Percentages scale with the account, which makes sizing up feel less dramatic.
- Calculate size. Size = 1R ÷ unit risk. Round down.
- After the exit, log two numbers. Actual R, and the reason for any variance.
For stocks, unit risk is what you lose per share. Futures add one step: point value times points gives the risk per contract, then divide 1R by that.
Wider stop, smaller size
This is where R earns its keep, and where day traders moving to swing trades get hurt most. An intraday stop might be 30 cents. Hold the same idea for several days and a sensible stop could be $2.40 away.
With 1R at $600, a 30-cent stop means 2,000 shares. A $2.40 stop means 250 shares. That's an 8x difference.
In practice you need to cut even more than 8x, because holding overnight adds gap risk. Plenty of traders anchor on their intraday share count when they start swinging, and then every normal wiggle feels like a beating. They get shaken out of trade after trade that never actually broke their system.
There is good news. If the move you're targeting is 5 to 10 times bigger, the trade is still worth plenty at the smaller size. 1R stays the same, the move gets bigger, and the R you earn can go up. Smaller size doesn't mean smaller opportunity.
1R can grow, just never mid-trade
You can change the size of 1R. One swing trader sorts trades into C, B, A and A+ tiers. At the start of the year, a normal B trade risked $6,500 and an A+ around $34,000. With B as 1R, an A+ is about 5.2R. Once a month he reviews, and if things are steady he adds about $600 to normal risk and scales the A+ tier to match.
So 1R moves up as you level up. Each time it does, give it a version number. Measure every trade with the version of 1R it was entered under. Bumping 1R after entry because you're feeling sharp today isn't an upgrade. It's editing the books.
More real cases
ACB: a tight stop and a huge R, with a catch
Back to ACB. Buy at $7.60, risk two cents, target sixty cents, 30 to 1. With +30R winners and −1R losers, break-even win rate is 1 in 31, about 3.2%.
Two things about this trade should make you careful with R.
First, the trader who took it called it good but not top tier: the pullback before the breakout was too deep and the consolidation wasn't tight. A theoretical 30R didn't make it a best-in-class setup. R tells you how much a trade pays. It doesn't tell you whether the setup holds up.
Second, a one-cent spread is half of a two-cent 1R. In this particular stock you often got filled at $7.60 without the price ticking against you, so real costs were usually lower. Move the same two-cent stop to a stock with a three-cent spread and the spread eats your whole risk before anything happens. The tighter your 1R, the bigger the share that costs take.
Allergan: a risk that doesn't fit inside 1R
A short-biased day trader, a few years into his career, shorted Allergan and kept a small piece overnight. After the close came news of a hostile takeover bid and the stock exploded in after-hours trading. By the time he saw the headline, the move was over.
He lost a bit over $80,000 on it, at a time when his daily risk limit was about $3,500. That's more than 20 times the limit. A very good month for him back then was around $15,000. One trade wiped out several months of work.
Overnight event risk gets its own treatment in Lesson 9. Here it's the hardest counterexample to R. That number was never in the planned risk, because nobody can write down "price after a hostile bid" in advance. R covers the risk you can measure before entry. Event risk has to be handled through position size. It won't fit in a 1R box.
Your whole life in risk units
You can push the R idea one level out. Picture a scale that snaps at 10. If your trading business already takes up 7 units of risk, everything else on the financial side, the mortgage, the startup, the loan to a friend, has to fit in 3.
That's not the same definition as R on a single trade, but the logic is shared: risk needs a unit before you can add it up. How many R you have on at once and how many R you can lose in a month come back in Lessons 13 and 14. For now, just get the unit in place.
Common mistakes
1. Pick the size, then find a stop. "I always trade 1,000 shares, so where can I put a stop that fits?" Now 1R is a function of size, and your invalidation has been taken hostage by it. Fix: invalidation first, then work the share count back from 1R. If the answer isn't your usual number, use the answer.
2. Moving the stop further away during the loss and calling the new distance 1R. This one does the most damage, because it erases the rule break from the books. Fix: 1R is fixed before the order goes in. If you move the stop mid-trade, keep the original 1R and log a violation.
3. Treating margin or notional as your max loss. In the ACB example, notional was $45,600 and planned risk was $120. Fix: three separate columns in your journal.
4. Ignoring multipliers, spread and commissions. A three-cent spread can wipe out a two-cent 1R on entry. Fix: convert costs to R on every trade. If 1R is smaller than costs, skip the trade.
5. Assuming the same R means the same risk. An overnight hold, a 0DTE option, a perp and a liquid index future can all be 1R planned, with completely different tails. You can't build risk management on the assumption that you'll always get out where you want. Fix: R is the starting point. Run stress scenarios for the tails separately (Lessons 9 and 14).
6. Treating one 1:7 as a 1:7 strategy. Go back to the opening: the first question was the win rate. Fix: always read R next to a sample. One trade proves nothing.
To check whether a reward-to-risk ratio holds up at different win rates, try the Risk Reward Calculator.
Where this breaks down
R works best when invalidation can be written as a price ahead of time, size can be adjusted freely, and costs can be estimated.
Be careful in three situations. First, non-linear payoffs like options: a $1 move in the underlying might move the premium 30 cents or 80 cents, so R is only an approximation and you need stress scenarios. Second, illiquid markets where you can't reliably get out, where −1R is a wish rather than a plan. Third, when living money and trading money aren't separated. Optimizing R means nothing until you've walled those off.
Exercise: the risk conversion desk
Material: three arithmetic problems below, plus one trade from your own replays.
- 1R = $120. Entry $218, stop $215. Find the size (round down) and the actual planned risk.
- 1R = $120. ACB bought at $7.60 with a two-cent stop. Find the size, the notional value, and how many R a sixty-cent gain is.
- 1R = $600. Same stock with a 30-cent intraday stop and a $2.40 swing stop. Find the size for each. Then take a swing position entered at $64 with a stop at $61.50 that gaps down to open at $55. Find the actual R.
- Pick a trade from your own replay. Hide everything after the entry, and write down invalidation, 1R and size. Then add one unfavorable fill and find the actual R.
Scoring (10 points):
- 3 pts: problems 1–3 are correct, size is rounded down, and notional isn't confused with planned risk.
- 2 pts: problem 3 comes out to −3.6R, and you note that the variance came from the gap without changing 1R.
- 2 pts: in problem 4, invalidation uses a price visible before entry, not hindsight.
- 2 pts: planned R and actual R are in separate columns, with a reason for any variance.
- 1 pt: you write one rule for refusing a trade, for example when the minimum unit already exceeds 1R, or costs exceed a set share of 1R.
Answers: Problem 1: 120 ÷ 3 = 40 shares, planned risk $120. Problem 2: 120 ÷ 0.02 = 6,000 shares, notional about $45,600, and a sixty-cent gain is 30R. Problem 3: 2,000 shares intraday, 250 shares swing. After the gap you lose $9 a share, −9 ÷ 2.5 = −3.6R. Redefine 1R by moving a stop after the fact on any problem and the whole sheet fails.
Log planned R, actual R and the variance reason in the Trade Journal Analyzer and the data is ready for Lesson 3.
Tools for this lesson
- Position Size Calculator: enter 1R and stop distance to get shares or contracts.
- Risk Reward Calculator: see what win rate a payoff ratio needs to break even.
- Trade Journal Analyzer: log every trade in R, planned and actual side by side.
Where this leads
- Before this: Lesson 1 separated decision quality from outcome. This lesson gives the outcome side a common scale.
- Next: Lesson 3 uses R to calculate expectancy. Lesson 11 covers where to put the stop, Lesson 13 sizes positions back from 1R, and Lesson 14 sets how many R you can lose per day, week and month.
- The psychology side: Lesson 19 covers outcome attachment. Once P&L is in R, a $3,000 day gets a little less exciting and you get a lot more honest about size.
Practice this lesson in NQ Replay
Put a fixed stop in an ATM template so every trade starts at a known 1R, then export the trades to CSV and convert each result into R. NQ Replay is our own app for practicing on past NQ futures sessions, replayed tick by tick in simulation, with bracket orders, prop-style loss limits and per-trade review. You can request a free 7-day trial; you'll need your own licensed NQ tick data.
For educational purposes only. This is not financial advice and makes no promise of returns. Tickers, dates and market moves in real trade examples come from public sources. Individual P&L and record figures have been adjusted. Illustrative figures are the author's own. Trading involves risk of loss.
Test it in the calculator
Size the trade from 1R
How far is your invalidation from entry, and how many shares does your 1R allow?
Example: 1R of $120, entry $218, stop $215, $3 risk per share, 40 shares.
Open the Position Size Calculator