
In one line: your reason for the trade decides where the stop goes: where the market proves you wrong. Structure, timeframe and volatility set the distance. The only thing you get to adjust is size.
Lesson 11 of the 30-part Trading Decisions course. By Eliza.
Lesson map
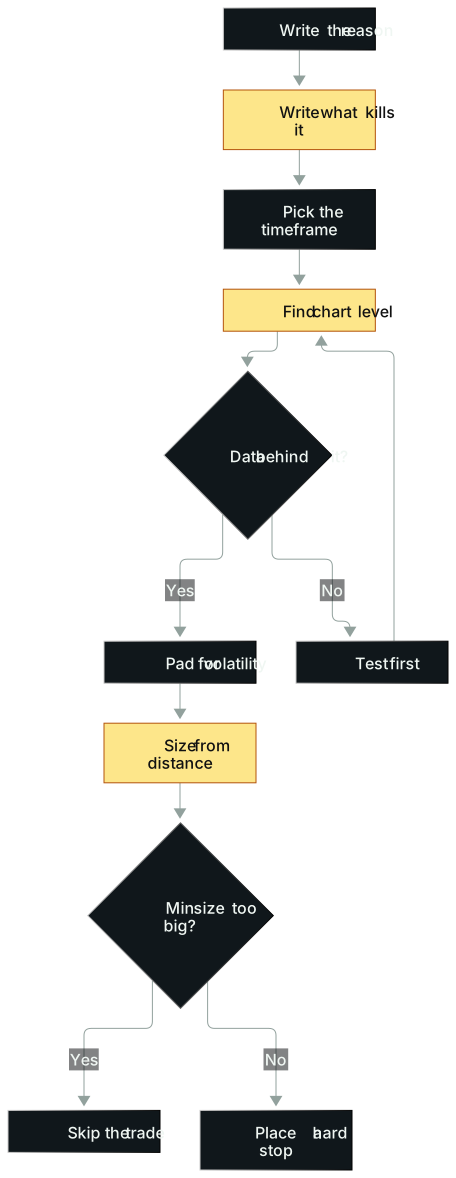
In words: Write the reason, then the evidence that would kill it, pick the timeframe that confirms it, and the invalidation lands on the chart. No data behind it, test first. Volatility sets the padding, distance sets the size. If even the minimum size breaks your budget, skip it; otherwise place a hard stop.
Opening: a chart puzzle whose answer is 20,500
In spring 2025, a trader posted a puzzle on social media: here's a daily chart of Nasdaq 100 futures (NQ). Pick the four most important days.
Most people remember the stretch. Tariffs were announced after the close on April 2, the index dropped through a double bottom near 19,000, and a second leg down began. The April 7 low was around 16,500 with the moving average near 19,500, about 15% below it. For an index the size of the Nasdaq, that's rare. Volume was huge and the news read like the end of the world: a capitulation low. On April 9 the U.S. announced a 90-day pause on the higher reciprocal tariffs for most trading partners, and the market ripped. Later, a gap bar broke the downtrend and confirmed April 21 as a higher low.
At that point the bears still had a plausible script: 20,500 is resistance, the bounce stalls there, the market pulls back and chops. The puzzle's author had pictured the same thing.
Then came May 12. News produced a gap straight through 20,500, and the index kept going. Not a doji, not an indecisive bar: pedal to the floor.
The answer to the puzzle sat on that bar. Anyone still bearish was wrong, and it was time to stop out.
The detail people miss: the reason to exit wasn't how much the bears had lost or how many percent the index had risen. It was that the bear script contained one line, "20,500 will be resistance," and this bar killed it on the spot. Kill the core line and the script is void, and so is the reason to hold.
Another detail: at the same level, the author started selling calls. Telling bears to leave doesn't mean telling everyone to flip long. He wasn't buying back because the reward-to-risk was great there. He was buying back because the bar had refuted the bearish view, the market saying plainly: it's not what you thought. When the old reason dies, exit on the old reason. A new trade needs its own reason and its own math.
That's all a stop is. At entry you write down what would show you're wrong. When the market gets there, you accept it. Your P&L and how much it hurts have nothing to do with it.
The idea
Put the stop where expected value turns negative
The stop belongs at the point where this trade's expected value flips from positive to negative. Most of the time that's where your reason for holding dies. Some pairs:
- A breakout above resistance: the reason is price leaving the range and holding above. Back below resistance, the reason is gone.
- A trending stock: the reason is higher highs and higher lows. Break the latest swing low, the trend is over.
- A stock riding a moving average: a close below it is the exit.
- A trendline trade: hold while it holds, leave when it breaks.
In each case the stop falls straight out of the entry reason. If you can't state the reason, the stop gets placed at random. And if someone can't say why the stop is where it is, they probably can't say why they entered.
One more angle. Before entry, the potential reward is an estimate, and so is the win rate. The one variable you can know with some confidence is how much you lose if you're wrong. A stop turns an abstract idea into a quantified risk. Without it, you can't compute expected value at all.
Chart levels beat round numbers
"I always leave at −2%." "I'll give this one to $10." Both sound disciplined. But the market doesn't know your 2% and has never heard of your $10.
Everyone who trades has to decide where they admit they're wrong, even those who swear they ignore charts. The only difference is whether that line is picked at random, set by emotion, or based on something plainly on the chart. Since the stop has to go somewhere, near a level where the market has already reacted beats a number pulled from thin air.
Zoom out: millions of participants trade on different timeframes for different reasons, and the one thing they share is managing risk. So many of them make decisions around the same obvious levels, and those levels matter. That's why longs reference recent lows and shorts reference recent highs. There's a flip side too: if a lot of participants are likely to stop out at a level, a fast day trader can short the break ahead of the bigger money.
The counterintuitive bit: when everyone's stop sits under the same low, that low is watched, and selling floods in when it breaks. A stop there, when hit, usually means a real break. A stop on a round number nobody cares about, when hit, may just be noise.
Match the stop's timeframe to the entry's
Enter on an intraday pattern, use an intraday stop. Enter on a daily pattern, use a daily stop. That trader learned this only after widening his playbook into swing trades.
IonQ is an example. It broke out of a clean daily consolidation above $50; he bought the breakout with the initial stop at that day's low and trailed the prior daily low, riding it to around $71. A trade entered on the daily doesn't get managed with a tight intraday stop.
He'd been burned exactly here when he first moved to swings: a daily setup whose sensible stop was about 8% below, and he stopped himself out on a 1.5% intraday dip because the 2-minute chart looked ugly (Lesson 13 picks up the sizing side). Testing a daily thesis with 2-minute noise is like measuring height with a thermometer.
Structure and volatility set the distance; size follows
Same system, different setups, very different stop widths. A breakout system with the stop at the day's low gets a much tighter stop when that low hugs resistance than when the bar's range is wide. That's often why one setup carries higher expected value than another: same target, smaller loss when wrong.
Volatile markets need wider stops on average. To keep the same dollar risk, the only lever is size. Most people do the reverse: same size in a wild market, then squeeze the stop tighter than their rules allow to hold the dollar loss constant, and in doing so break their own system.
The stop comes from invalidation; size comes from the stop distance. Reverse the order and the stop becomes a number invented to fit a position size (Lesson 13 covers the arithmetic).
Stop width has to match your profit distribution
On a platform where traders publish daily P&L, one seven-figure trader had a long-run win rate above 90%, with most green days in the low-to-mid thousands. When someone urged him to set stop parameters, he didn't buy it: as long as there was opportunity, keep trading. Then he lost about $190,000 in a day (Lesson 3 runs these numbers).
For high-probability, high-win-rate traders, stops are their best friend. It's about the distribution. If you make small amounts per trade, there's no long tail on the profit side, so you can't allow one on the loss side or a single day hands back dozens. A home-run trader, who sometimes earns a dozen-plus times a normal day, can afford a wider ceiling. The question to ask: how many days last year made more than $80,000? If the answer is zero, losses of that size shouldn't exist either (Lesson 3 works the expected value).
The method: five steps to set a stop
1. Does it make strategic sense? Write the entry reason, then the evidence that would refute it. The stop goes where that evidence would appear. Check: read your stop to someone and say which line of your reasoning fails there.
2. Is the timeframe right? The timeframe you entered on defines invalidation and confirmation. You can use a lower timeframe to refine entry, but not to swap a daily invalidation for a 2-minute one. Check: is it "trades below" or "closes below," and a close on which timeframe?
3. Is there data behind it? This is the step that matters most. For a daily breakout like IonQ, collect as many similar charts as you can, such as daily breakouts in Tesla or Bitcoin, propose a few stop rules from what you see, and test each: trail the prior bar's low; hold until a close below the 20-day average; or target a measured move from the range. Take the best one and forward-test it on live price action. Professionals don't guess and don't go by what feels comfortable. The sample must include every setup that meets your preset criteria, not just the charts where the stop looks pretty (Lessons 25 and 26).
4. Has the environment changed? Volatility expands, the stop widens, size shrinks. Loose structure, wide stop; only tight structure earns a tight stop. In illiquid names, fills come worse than the stop price, so leave slippage room in planned risk.
5. Can you execute it? The best stop is worth nothing unexecuted. If you can't pull the trigger emotionally, hand it to the machine: a pre-placed hard stop, automation, a daily max-loss limit. If that's still not enough, cut size to lower the emotional weight, then add back slowly.
On paper, one row per trade before entry:
| Entry reason | Refuting evidence | Timeframe | Invalidation | Slippage pad | Risk budget | Size |
|---|
The risk budget comes from your account rules first; size is then computed from that budget, the invalidation distance and the slippage pad, so I fill it in last.
Hard vs. mental stops: a hard stop is a real resting order. It takes the decision out of the moment, but it doesn't guarantee the fill: stop-market orders can slip and stop-limit orders may not fill, and a brief imbalance can knock you out of a still-valid trade. A mental stop gives experienced traders room to read the tape and the news, at the cost of iron discipline, and plenty of people who claim mental stops simply have no stop. If you're unsure, use a hard stop (Lesson 10 compares the three kinds).
More real cases
ACB: a one-cent spread, two cents of risk, sixty cents of reward
ACB was a cannabis stock. On April 2, 2024 it printed a breakout bar above its $4 to $5 range but closed at $5, not clear of the range, so April 3 counts as breakout day one. There was a news catalyst, a cannabis executive joining a lobbying group, and ACB was the strongest name in the group.
Intraday it probed lower, broke the prior bar's high (just above 7.40), pulled back and sucked in shorts. When it cleared the whole high range, those shorts got stopped out.
Most debate centered on which breakout day this was. The variable everyone missed was liquidity: a one-cent spread and roughly a million shares per two-minute bar. In a name that liquid, you may need to risk only a cent.
The math: buy 7.60, risk two cents, and under a trailing system you might not be stopped out until sixty cents of profit, 30:1. In theory, a trade like that only needs to work less than 5% of the time. A stop under the lower lows below would also be worth taking; with that liquidity, it just isn't necessarily needed.
The point: how tight a stop can be depends partly on the instrument, not just your nerve. A one-cent spread and huge volume make entry and exit almost free, so invalidation can be defined very close. Try it in a small cap with a twenty-cent spread and a two-cent stop is a joke: price jumps past it before your order fills. Overall this was a good but not top-tier setup, because the prior pullback was deep and the base wasn't tight.
Using options instead of a price stop
A trader who specializes in shorting parabolic runs found his biggest losses usually came from being a day or two early. Our own numbers: a stock runs from 40 to 52, he shorts at 52, and over the next day it trades 49, 53, 50, 54. In the past, the dip to 49 looked like the top, he pressed the short, it squeezed again, and that's where the big losses came from.
His fix: buy far out-of-the-money calls first, then short the stock. Our own numbers again: pay 40 cents for a 56-strike call, short 2,000 shares at 54, and buy 20 contracts to cover them. Until the calls expire, max risk is $2 from the short to the strike plus 40 cents of premium, $2.40 a share, $4,800 total (before borrow costs, dividends and commissions).
I don't call this a "natural stop." The trade has no price stop. What the call does is cap maximum risk until expiration.
Two benefits. The position gets room to survive the 49, 53, 50, 54 chop. And it can be held overnight: when a parabolic stock closes at the high, normal shorts won't hold because the upside is unbounded. The question shifts from nailing the exact top to being right over the next two or three sessions.
The costs too. If the stock goes sideways after a big run, the premium decays every day while the short doesn't pay. You need to understand theta and option pricing. I wouldn't start beginners on options, which work a lot like buying insurance, and doing this on every stock bleeds money.
A stop exists to cap the worst loss. A price stop is one cap, though a gap can blow through it; an option is another. Pick based on how you tend to be wrong. If you're wrong by being a day or two early, you're buying time and room.
TIGR: an option seller draws breakeven on the chart
In late September 2024, China announced major stimulus and Chinese stocks rose 30% or more in weeks. TIGR, a Chinese broker, ran especially hard, nearly quadrupling. On October 7 it gapped up big, trading around $14. The trader sold the October 18 calls at the $16 strike that day for roughly $1.80 in premium.
The method: draw the expiration breakeven on the chart, 16 plus 1.80, about $17.80. Then look at what kind of move it would take to get there and ask: if assigned short stock, would I want to hold it? Yes, and expiration was only a little over a week away. $17.80 is the expiration line, not a stop level; before expiration, closing P&L also depends on time value and implied volatility. Waiting for implied volatility to really blow out before selling is where the edge sat.
This trader didn't use a traditional price stop on the short calls, and an uncovered short call has no cap on potential loss, so "I'm wrong" gets a different definition: price beyond breakeven, in a position you wouldn't want if assigned. Drawing that line forces you to answer, before entry, what being wrong looks like. The source doesn't say how much the trade made.
When price jumps straight past the stop
A stop order doesn't guarantee a fill price. Gaps, halts and breaking news can carry price well beyond it. A trading-book author once asked that trader: what do you do when price blows through your stop?
Most people assume the answer is to get out without hesitation. Not necessarily. Exiting at that price is sometimes absurd, with deeply negative expected value. If a stock gaps far below your stop and, flat, you'd be buying right now, why sell on autopilot?
Imagine you have no position and assess the expected value from here, objectively. If it's strongly positive, you can hold or even add, but set a new hard stop on the spot for the extra risk you're willing to take. The old stop failing doesn't mean risk management disappears.
There's one exception, and it's the hardest rule: if more adverse movement would breach account-level risk rules and produce a loss you're never willing to take, you're out. Breaking a single-trade rule and breaking an account rule are very different. The first can flex on expected value; the second protects your psychology, capital and survival, and is almost non-negotiable (Lessons 14 and 16).
This exception is easy to abuse. The premise is "flat, I'd buy now," judged calmly. Someone just stunned by a gap is the most likely to dress up reluctance to sell as a fresh expected-value assessment. Easy test: after the reassessment, is there a new hard stop resting in the market? If not, it's an excuse.
Common mistakes
1. Widening the stop as price approaches, then widening it again. This is the number-one mistake. It ends with no stop at all, a forced long-term holder, and weeks of gains erased in one trade. The small-cap short seller from Lesson 5 described the slide; here it is in our own numbers: short a stock with a stop at $4; it hits $4 and you stay; at 4.40 you'll leave if it comes back to 4; at 4.80 you're hoping for 4.40; then 5.50, 6, 7, and you're finished. Back then he simply froze and couldn't press the button. Another day he lost about $350,000 in TOP, and that also started with no stop (Lesson 19). Fix: broker-side hard stops, and hand everything you can to the machine: daily max loss, max loss per name, max size, auto-flatten. His own analogy: don't keep chocolate cake in the house, because if it's there he'll eat it.
2. Using round numbers and fixed percentages instead of evidence. "Out at −2%" looks neat. Price doesn't care about your mood or a line you drew at random. Fix: find the chart invalidation first, then measure its distance from entry. The percentage is an output, not a rule.
3. Volatility rises, size stays, stop tightens. That's editing the stop to fit a dollar amount, and once it's tighter you're no longer running the original strategy. Fix: let the stop widen with structure and cut size. If even the minimum unit breaks the budget, pass.
4. A daily setup with a minute-chart stop. Fix: before entry, write which timeframe's close counts.
5. Believing the market hunts your stop. Mature traders rarely say this; it's mostly beginners with arbitrary stops. Ask: if the manipulation were reliable, why not trade alongside it? If it isn't reliable, you're back to the previous point: your level was arbitrary and randomness is fooling you. Fix: log every stop-and-reverse. Once you have enough, compare the full results of "exit on a break" vs. "exit on a close," and change the rule on data. Changing it after one stop-hunt lets your latest trade write your rules.
6. Claiming a mental stop. No order in the market, just "I'll leave when it gets there." With real money on the line, people are great at explaining away losses. Fix: unless you have a continuous record of executing it, use a hard stop.
Where this applies
This works for trades where you can state the reason and the refuting evidence in advance. In these cases the stop price doesn't represent your maximum loss:
- Gaps, halts and overnight events. Severe slippage, violent gaps and halts happen far more often than most people think. They're normal market reality, not black swans.
- Shorting very low-float stocks. After ZJYL hit a limit-up halt, it reopened at more than ten times the price (Lesson 16).
- Nonlinear products such as options. A 1% to 2% move in the stock can mean a 30% to 50% loss in the option.
In those cases, run a separate worst-case stress test, limit exposure through smaller size, or use an option structure to lock the maximum loss.
FX and CFDs work the same way: the stop comes from chart invalidation, distance is often gauged with ATR, and size converts through pip value. Weekend gaps and spreads that widen outside the main sessions can both fill you worse than the stop.
Long-term investors need price stops less; they exit when the investment thesis is disproven. That's invalidation on a different timescale, and it still has to be written down in advance.
Practice: the three-stop table
Material one, decide with the outcome hidden:
- IonQ breaks out of a daily consolidation above $50. Write your initial and trailing stop rules and the confirming timeframe. Then compare with the original approach: initial stop at that day's low, trailing the prior daily low, out near $71. Would your version have shaken you out on the first day's intraday dip?
- ACB's small flag above 7.40, a one-cent spread, about a million shares per two-minute bar. Write your stop, then explain how stop and size would change with a twenty-cent spread.
Material two, your own sample:
Take 12 consecutive trades from one strategy and fill all seven columns for each. Then design three versions per trade: a structural stop, a volatility-based stop, and an arbitrary tight stop. With outcomes hidden, judge which version stays true to the original reason; then reveal and compare the three on win rate, average P&L and longest losing streak across the 12.
Scoring (12 points):
- 3: every invalidation is visible, not backed out of a dollar loss.
- 2: entry and stop on the same timeframe; exceptions have pre-written rules.
- 2: size derived from budget and stop distance, rounded down.
- 2: slippage, gaps or minimum unit limits accounted for.
- 2: consecutive samples, not cherry-picked charts.
- 1: states that a trade is skipped when even minimum size exceeds the budget.
Reference: a passing row reads roughly: bought the break of a daily base above 50; refuting evidence is a close back inside; daily confirmation; invalidation at the day's low; 0.5% slippage pad; $240 risk budget; size from distance, rounded down. Automatic fail: widening or cancelling the initial stop intraday, or rewriting the entry reason afterward.
With your invalidation set, back out share count from budget and stop distance in the Position Size Calculator, and use the Stop-Loss & Take-Profit Calculator when you need both order levels. For FX, PipGauge's ATR Calculator gives a first read on the distance volatility hands you.
Tools you can use
- Position Size Calculator: risk budget ÷ stop distance = size.
- Stop-Loss & Take-Profit Calculator: turn invalidation and target into order prices.
- ATR Calculator (PipGauge): a volatility distance reference for FX and CFDs.
How this connects
- Upstream: Lesson 10 defines triggers and invalidation; this lesson turns invalidation into a price and a confirmation rule. Lesson 8's multi-timeframe work decides which timeframe confirms.
- Downstream: Lesson 13 sizes from this lesson's stop distance; Lesson 12 covers moving stops and scaling out after entry.
- Downstream: Lessons 14 and 16 hold the account-level rules, the one non-negotiable exception to "price jumped my stop."
Practice this lesson in NQ Replay
Put the stop where the idea is wrong, then check each trade's MAE afterwards to see whether the stop was tighter or looser than the idea needed. NQ Replay is our own app for practicing on past NQ futures sessions, replayed tick by tick in simulation, with bracket orders, prop-style loss limits and per-trade review. You can request a free 7-day trial; you'll need your own licensed NQ tick data.
For educational purposes only. This is not financial advice and makes no promise of returns. Tickers, dates and market moves in real trade examples come from public sources. Individual P&L and record figures have been adjusted. Illustrative figures are the author's own. Trading involves risk of loss.
Test it in the calculator
Stop placed? Now size the trade
You have a risk budget and a stop distance. How many shares can you buy?
Example: $30,000 account, 0.8% risk = $240, entry 42.30, invalidation 41.10, distance 1.20: 200 shares max.
Open the Position Size Calculator