
The short version: "this is going up" is an opinion, and nobody can disprove it. Rewrite it as a rule someone else can check, "fits" or "doesn't fit," without knowing the outcome. Only then has it earned a test, and only then has it earned the right to lose your money.
Lesson 4 of the 30-part Trading Decisions course. By Eliza.
How this lesson fits together
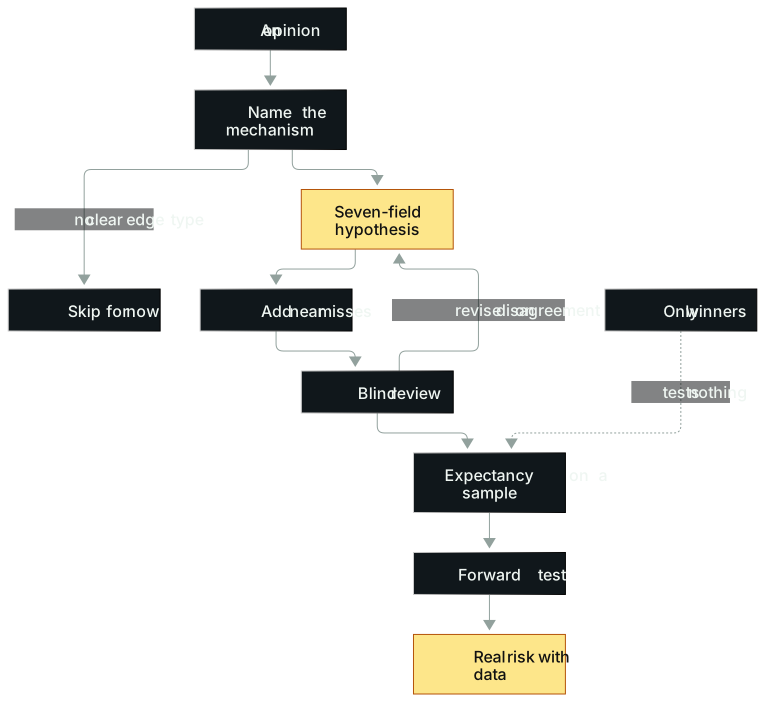
In words: (1) An opinion first has to name a mechanism. If you can't say what kind of edge it relies on, don't trade it yet. (2) If you can, write it as a seven-field hypothesis, pair it with counterexamples and write the exclusions. (3) Run a blind review with the right side of the chart hidden; disagreements only send you back to revise the definition. (4) After that, compute expectancy on a continuous sample, forward test, and put real money in only once the data is there. (5) A sample of positive examples alone can't test anything.
Chipotle, a few minutes, and the night before
A futures trader who has been full time for a little over five years was asked about his first trade with a real edge. He still counts it among the trades he's proudest of, for a plain reason: he planned it, backtested it, and executed it live.
The story starts the night before. He had come across a pattern online and in a book on anchored VWAP, called a strong earnings gap. The logic made sense to him, so he started backtesting.
Chipotle (CMG) had reported and gapped to an all-time high. His question: when a stock gaps to an all-time high and starts going up right away, what happens next? He went back through the data, and Chipotle alone had done it two or three times before.
He admits he didn't fully know what he was looking for, roughly a gap up that keeps going. He wrote one condition for the next day: if it rips straight up from the open with barely a pullback, buy calls.
At the open there was a green one-minute candle, and he went in. About 8 contracts at roughly $1, so about $800 at risk. The stock ripped, the option spreads went absurdly wide, and at first he couldn't get out of anything when he tried to scale. Eventually most of it filled, and in about four minutes he made roughly $2,600.
On the Lesson 2 scale, $2,600 ÷ $800 = 3.25R.
He quickly added two less flattering points. First, luck played a part. Chipotle hadn't split yet, its options were expensive, and the mispricing he caught happened to fall his way. Second, he later learned that not every gap-and-go is the same, and not every strong earnings gap is the same either.
Laid out as a path, it's four steps:
- Find a type of trade that makes sense, and ask why it might work.
- Treat it like science: form a hypothesis, then go to the data.
- Ask when it's stronger, for example at all-time-high breakouts or with a news catalyst.
- Keep refining: which variables make it worse, which make it better.
One caution for readers. Two or three historical instances are, by the Lesson 3 standard, a lead and nothing more. Luck was part of that day's profit. The story is worth telling because the order is right: a reason, then observable conditions, then the data, and only then money. Plenty of people do it backwards. They spend the money and find the reason afterwards.
The ideas
Opinions can't lose, so they can't be tested
"Technical analysis works." "There's support here." "This pattern is strong." All three share one flaw: none of them allows itself to be proven wrong. If price goes up, you were right. If it goes down, someone must have slammed it through support.
Take support and resistance. Pick random stocks with no context, backtest every horizontal line someone sketched on a chart, and you should expect a lot of noise. Whether support and resistance carry predictive information has to be tested for a defined market, sample, drawing rule and cost model; one study's result does not generalize to every setting.
Edge comes from getting more and more selective about when a concept applies. Applying the same line indiscriminately may dilute any predictive information. Put it inside conditions like a stock in play, a clear level and the right kind of consolidation, and it might carry information. Writing down "when" is writing a hypothesis.
A cautionary example: Fibonacci
Fibonacci retracements get called astrology for day traders. Picture a stock running from $150 to $250. Someone draws the retracement levels: 38.2% at 211.8, 50% at 200, 61.8% at 188.2. Price slices through 211.8, breaks 200 like it isn't there, holds 188.2 for five minutes and keeps falling. Three levels, three falling knives caught.
Now a thought experiment: flip the chart upside down and draw the Fibonacci levels again. You'll still find levels that "worked." Brains love patterns, even where there aren't any. Draw enough lines and, looking back, one of them will always look brilliant.
There's one test for any opinion: can you build a system around it that keeps an edge over the long run? And the easiest person for you to fool is you.
Edge has only a few sources
A hypothesis worth testing has to answer at least one question: why would I be right when others aren't? Trading edge falls roughly into six types:
- Information: news, data or analysis that isn't widely available yet. A professional terminal gives you one, but now you're mostly competing with institutions.
- Technology: low latency, algorithms, even hotkeys. For retail traders, that means faster alerts, a more direct live news feed, or writing your own scrapers.
- Analysis: same news, better read. Someone who understands FDA trials trading biotech, for instance.
- Psychology: discipline and emotional control.
- Liquidity: small and nimble enough to take opportunities that don't move the needle for big funds.
- Structure: borrow availability, arbitrage, the huge ETF discounts that open up in extreme markets.
Good traders often combine several. Edge can also be temporary. Once other participants adapt, it erodes.
Prediction markets offer a brutal self-check. A contract at 65 cents means the market prices the event at 65%. The only question is whether that probability is wrong by enough to cover fees, friction and risk. If you can't say which type of edge this bet relies on, you probably don't have one.
The flip side is the trader who's good at stocks and assumes the edge carries over to other arenas. Chart-reading skill doesn't help in sports betting, where algorithms push prices into place the moment a result is known. The interface changes. The game doesn't. Edge belongs to a market. It doesn't travel.
The acceptance test: someone else can check it
A good hypothesis has two features. First, it can fail: you can say what would prove it wrong. Second, someone else can check it: another person looking at the same pre-entry chart can say "fits" or "doesn't fit," and most of the time they agree with you. If only you can explain it, and only after the outcome, it's a story, not a rule.
The method
Seven fields
Write the opinion as seven fields, and fill each one with things you can see before entry.
| Field | Vague version | Testable version (breakout example) |
|---|---|---|
| 1 Instrument and time | Strong stock | A stock up strongly after the open, regular session |
| 2 Context | Market's fine | Stock in play, news catalyst, clear level |
| 3 Pattern | Nice consolidation | At least an hour of consolidation with higher lows |
| 4 Trigger | It broke out | On a pre-chosen timeframe, the breakout candle closes above the prior high of day; enter only on the next bar |
| 5 Invalidation | Get out if it's wrong | Trades below the low of that already-closed breakout candle |
| 6 Exit and costs | Depends | Trail with the 10-period MA; spread, slippage and fees counted in R |
| 7 Exclusions | None | News or no news, around major data releases, abnormal spreads |
"Up strongly" isn't quantified yet. How much is strong? Pick a number and write it down as something to test. For example: the gain in the first 30 minutes beats the median gain for the same window over the stock's past 20 sessions. That number is a hypothesis, not a truth. If the data doesn't support it, change it, and when you change it, start a new version (Lesson 3).
Break "clean level" into things you can count
Good breakouts tend to share five features, and each can be measured:
- Stock in play. Unusual volume, unusual volatility, a major catalyst, or a standout technical pattern, with lots of traders watching.
- A clear level. Another competent trader pulling up the same chart finds the same level without you explaining it.
- The right consolidation. How far price pulled back before the break, and how loose the pullback was.
- Emotional reaction. When the level breaks, does volume expand and does price leave quickly?
- Multi-timeframe agreement. The more timeframes a level matters on, the better.
You don't need all five on every trade. The more favorable conditions stack up, the better. Even a perfect-looking setup can fail.
The point is to turn each feature into a countable field. For "clear": in the last 30 minutes, how many times did price stall at this level, and how many times did it close through it? Count it, and you can compare the expectancy of "clear" and "not clear" samples.
Give every rule a counterexample
Look only at positive examples and you can prove any pattern works. Pair each rule with a chart that looks right but shouldn't be traded: no catalyst, a breakout in a dead volume window, a level price keeps slicing through.
FSLR makes the point well. A veteran US equities day trader asked online what reasons might lead him to take a swing long in First Solar. In the twenty-odd replies, nobody mentioned whether the stock had news. Yet for stock traders, news is close to the most important variable. A simple yes or no on news can decide how to trade it.
With news, you usually trade with the move and rarely look for mean reversion. Without news, mean reversion is on the table. Fade a stock that just had fresh news and you're in for a rough time. When backtesting a pattern, ignore that one variable and many backtests will end up failing.
Put news in field 7 and the same rule set splits cleanly into two halves.
The order of validation
- Collect examples first. Sort screenshots by setup in a notes app and build your own case library. Get to ten or more, ideally far more, before studying variables: what makes it better, what makes it worse, where entries, stops and targets sit.
- Blind review first. Hide the right side of the chart and see whether the same set gets judged the same way (see the exercise).
- Then expectancy on a continuous sample. Lesson 3 covers the method.
- Then forward testing. Can the backtest definition be executed under live pressure?
- Real money only with data. A positive average in a sample is not proof of true expectancy. Freeze the rule, retest on a held-out sample and in forward testing after costs, then weigh sample uncertainty and loss you can bear before allocating real risk. Treat trading like a scientist. Test, don't guess.
More real cases
"Day trading is dead"
More than a decade ago, a fresh graduate who later became a veteran day trader had two offers: a sales and trading seat at a big bank, and a day trading seat at a prop firm with a very low starting salary. A manager at the bank heard he was considering the prop job and told him day trading was dead, that nobody made money at it anymore.
He didn't believe it, and he didn't go on enthusiasm either. He checked. The manager turned out to be flat wrong: traders at that firm were making more than ever. He took the job.
When an authority tells you something, it's still an opinion. An experienced person declaring a style of trading dead sounds like fact, but it's a judgment that was never written as a hypothesis. Dead by what measure? Who isn't making money? How much counts as making money? Turn it into a question you can check, go find actual income data, and the answer appears.
Look back a few decades and that line gets repeated every few years: after the dot-com bust, when US stocks moved to decimal quotes, as algorithms and high-frequency trading took off. For some strategies it was true. But traders adapted to the new structure, and the game changed shape instead of disappearing.
STRC: write down "a dividend cut is unlikely"
In late June 2026, STRC sold off hard on heavy, panicky volume. A veteran trader sold puts on it, judging that the odds favored price stabilizing or bouncing.
He wrote his core view as one sentence: a dividend cut is a low-probability outcome. Then he listed his reasons. The company had built a sizable cash reserve specifically to pay preferred dividends. It needed to keep access to the debt markets and to protect investor trust in its broader credit strategy.
Two more points. High implied volatility meant the premium collected could offset some loss if a cut happened, but a sharp drop can still leave short puts with large losses. And he used an AI tool to help list stress scenarios; that cannot confirm event probabilities or trade expectancy. STRC is a perpetual preferred with no fixed maturity redemption; neither the dividend nor a return near par is guaranteed. The P&L was never made public, so this case is only about how he thought, not how it turned out.
The structure is the full shape of a hypothesis: a view that can be proven wrong, a few reasons, and an answer to "what's left if I'm wrong." Securities like this are priced on yield, credit risk and the odds of getting par back, not on earnings expectations, and few people follow them. He was betting where he understood more than the typical participant.
Breakouts lose overall, catalyst breakouts make money
A common situation: your breakout trades lose money overall, but the subset with fresh news catalysts makes money. A strategy losing money doesn't mean you delete it. Sometimes it's one adjustment away.
That turns "one big category loses" into two subcategories, one losing and one winning. The broad hypothesis, "breakouts make money," is not supported by this sample. The narrower one, "breakouts with a fresh catalyst make money," hasn't been rejected and deserves more testing. That's what counterexamples are for: they only produce a new hypothesis to test. After you freeze the filter, check after-cost results on a sample that was not used to pick the filter, and in forward testing; a positive sample average is not proof of true expectancy.
Common mistakes
1. Using adjectives as conditions. "Strong," "clean," "calm" mean something different to every reader. If a review lists the day's goal as "stay calm while trading," push on it: what tends to set you off? How will you avoid it? What does calm actually look like? Fix: swap every adjective for a number, a price, or a reference someone else can check.
2. Saving only the winners. Building a case library and studying what hundreds of top setups have in common only works if you save every instance that meets the definition, not just the prettiest. Fix: if it qualifies, save it. File the non-qualifiers separately. Don't toss things on feel.
3. No exclusions. Without "when not to trade," any similar-looking chart gets in and the sample turns into a stew. Fix: field 7 can't be empty. Write at least one, such as news or no news.
4. Changing the definition after seeing the right side. If the blind review shows a chart was misjudged, you may only revise based on why people disagreed, not on what price did next. Fix: sort every disagreement into one of four bins (unclear term, missing threshold, information not visible, missing exclusion) and fix only those.
5. Using someone else's numbers as your rules. The 10-period MA and the breakout candle low are a demonstration. In another market or timeframe they may not be best. Fix: borrow the structure, test the thresholds yourself.
6. A hypothesis that's too broad. If all ten charts get judged "fits," the rule lets nearly everything in. Fix: mix near misses into round two and see whether the rule stops them.
7. Carrying an edge from one market to another. Fix: a new market is a new hypothesis. Write it again, test it again.
Where this breaks down
This framework suits short- to medium-term strategies you can reconstruct from historical charts and trade data.
It doesn't fit three situations. Intuitive judgments that can't be recorded: forcing them into rules is just for show. Backtests that use ordinary price charts alone may miss news-release timing, halt status and data revisions; without contemporaneous data and fill constraints modeled, they cannot prove the strategy would have been fillable. And hypotheses that depend on non-public information. Illegal information edges are out, full stop.
Edge also decays. A hypothesis that passes today needs a recheck next year (Lesson 27).
Exercise: the ten-chart blind definition test
Material: pick a setup you use often and write the full seven-field hypothesis. Prepare ten charts with the right side hidden: five that fit and five near misses, shuffled. If you can't pick one, use "breakout after higher lows" and fill in fields 1, 2, 7 and the thresholds yourself.
Steps:
- Re-judge them yourself the next day, or have a partner judge independently. Answer only "fits" or "doesn't fit" for each, name the rule that triggered, and don't predict outcomes.
- Calculate the agreement rate. Put each disagreement in one of the four bins.
- Revise the definition based only on disagreements, without looking at the right side.
- Retest on a fresh set of ten and see whether disagreements drop.
Warm-up: rewrite this in seven fields. A stock drops after earnings, you read it as shaking out weak holders, and you buy when it gets back to the VWAP area and buyers reappear. Circle the adjectives that need to become numbers.
Scoring (14 points):
- 4 pts: all seven fields are complete, and each can be judged before entry.
- 2 pts: at least three near misses, with the difference from positives written as a condition.
- 2 pts: the right side was truly hidden during the blind review.
- 2 pts: disagreements are categorized.
- 2 pts: no P&L appears in the reasons for revising.
- 2 pts: agreement improves in round two, or you explain why it didn't.
A high round-one agreement rate isn't automatically good. Ten out of ten "fits" usually means the rule is too broad. Any rule that uses future highs or lows, or hindsight "it looked strong," fails the whole sheet.
Once the definition is frozen, log the continuous sample in the Trade Journal Analyzer, and when you have enough, run it through the Expectancy Calculator.
Tools for this lesson
- Expectancy Calculator: once the hypothesis is frozen, calculate net expectancy from a continuous sample.
- Trade Journal Analyzer: log every qualifying instance by version, including the ones you skipped.
Where this leads
- Before this: Lesson 3 showed how to calculate expectancy from a continuous sample. This lesson defines what counts as a sample in the first place.
- Next: Lesson 5 tightens setup definitions and exclusions, Lesson 6 covers zones with no edge, and Lessons 7 through 9 cover common variables like trend, location and news. Lessons 25 and 26 cover backtesting and forward testing without peeking at the future.
- The seven-field file you produce here is raw material for every trade plan, review and scorecard that follows.
Practice this lesson in NQ Replay
Write the hypothesis down before you press play, and use the Unplayed picker so the test runs on days you haven't played yet. NQ Replay is our own app for practicing on past NQ futures sessions, replayed tick by tick in simulation, with bracket orders, prop-style loss limits and per-trade review. You can request a free 7-day trial; you'll need your own licensed NQ tick data.
For educational purposes only. This is not financial advice and makes no promise of returns. Tickers, dates and market moves in real trade examples come from public sources. Individual P&L and record figures have been adjusted. Illustrative figures are the author's own. Trading involves risk of loss.
Test it in the calculator
Give your hypothesis an expectancy
Once the setup definition is frozen, what do the win rate and average win and loss look like on a continuous sample?
Example: 30 consecutive trades, 40% win rate, 2.1R average win, 1R average loss, +0.24R gross.
Open the Expectancy Calculator