
The short version: expectancy is the average result of one type of trade repeated many times. You can only calculate it from a continuous, unfiltered sample, and even then it's an estimate, so it should come with a note on how shaky it is.
Lesson 3 of the 30-part Trading Decisions course. By Eliza.
How this lesson fits together
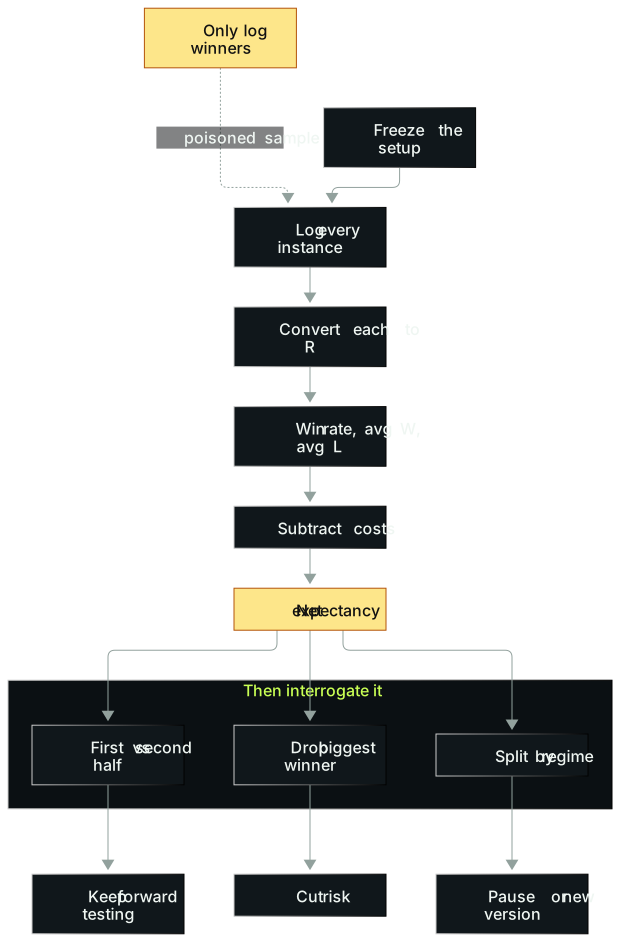
In words: (1) Freeze the setup definition, log every occurrence in a row, and convert each trade to R. (2) From that, get win rate, average win and average loss, subtract costs, and you have net expectancy. (3) Then interrogate it three ways: compare the first and second halves, and if they disagree keep forward testing; remove the biggest winner, and if the edge collapses cut risk; split by market regime, and if it only works in one, pause or revise the version. (4) The most common contamination is logging only the winners. Once the sample is dirty, no careful math downstream can save it.
A coin, flipped once, ten times, a hundred times
Here's a game. I give you a fair coin. Heads, I pay you $150. Tails, you pay me $50. Neither of us knows what's coming next. Do you play?
Of course. Every flip is worth +$50 to you on average: half the time you make 150, half the time you lose 50, so 75 minus 25.
A trader's job is mostly hunting for spots like this in the market, where the math leans your way. One useful way to judge a trade: if this exact situation repeated a thousand times, would I take it every time? That question has an answer. Whether this one trade wins does not.
So what does "+$50 a flip on average" actually feel like? I worked it out from the coin rules:
| Flips | Average profit | Chance of ending flat or down |
|---|---|---|
| 1 | $50 | 50% |
| 2 | $100 | 25% (lose both) |
| 10 | $500 | about 5.5% |
| 100 | $5,000 | about 1 in 3.5 million |
The first row hurts. Play once and you're as likely to lose as win. A plainly good game has a one-in-four chance of losing both of its first two flips.
Losing streaks don't go away with more flips either. Over 100 flips, the chance of seeing at least five tails in a row somewhere is about 81%. Over 1,000 flips, the chance of ten in a row is about 39%. Ten straight losses leave you down $500, while the game is still worth +$50 a flip.
Shrink the payoff and the pattern holds. Heads +20, tails −10: ten flips are expected to make $50, yet there's still about a 17% chance you end flat or down. At 100 flips that falls to about 0.04%. Play a few thousand times and the chance of ending down keeps shrinking, though it never reaches zero, and real trading rarely offers odds this clean.
Expectancy describes the average of one decision repeated many times. It has no say over the flip in front of you. If that flip loses, should you keep playing? Yes.
The trouble is that no one tells you "heads 150, tails 50" in real trading. You have to count it yourself. This lesson is about how.
The ideas
Four variables
Expectancy = win rate × average win − loss rate × average loss
If it's still positive after commissions, spread and slippage, the trade is worth taking. Zero or negative, skip it.
In R, every variable is unitless, so trades in different instruments and accounts can be combined (Lesson 2). Say the win rate is 45%, average win 1.8R, average loss 1R:
0.45 × 1.8R − 0.55 × 1R = +0.26R
That's gross expectancy. With average costs of 0.06R a trade, net expectancy is +0.20R. Costs ate more than a fifth of it.
Win rate is not the goal
There's a classic interview question for traders: how high a win rate do you need to succeed? Sharp candidates spot the trap. Win rate isn't the point. What matters is whether expectancy is positive.
Losing more than you win, per trade, can still be worth it. A trade wins $9 70% of the time and loses $15 30% of the time. The loss is bigger than the win. Should that scare you? Run it: 0.7 × 9 − 0.3 × 15 = 6.3 − 4.5 = +$1.80. Take it.
Both extremes can work. Some top traders win only two trades in ten and make it up by winning big. Others win nine in ten, make 25 cents for every dollar risked, and live on extremely tight loss control.
Check the thresholds. At a 20% win rate and 1R losses, winners need to average 4R just to break even, and more than that to make money. At 90% with 0.25R wins and 1R losses, expectancy is 0.9 × 0.25 − 0.1 × 1 = +0.125R. Let the average loss grow to 2.25R and it's zero. Let it slide to 3R and it's −0.075R. The first type wins big. The second type loses small, and can never let a loss get away.
The high win-rate trap. Insurance companies collect premiums most of the time and look like they're always winning. Win $1 95% of the time, lose $19 5% of the time, and expectancy before costs is zero. Selling far out-of-the-money options has the same shape. Selling options can be a fine strategy. It just isn't a free lunch. A high win rate doesn't mean safe.
Break-even win rate, with room for error
At a 2:1 payoff, break-even win rate is 1 ÷ (1 + 2) = 33.3%.
The head of a futures prop evaluation firm described their data in an interview. Traders running roughly 2:1 reward-to-risk tended to be among the best on the leaderboard. One example traded Nasdaq futures, held about three hours per trade, and averaged a $420 win against a $210 loss. At that ratio, he said, you need roughly a 40% win rate to stay profitable.
That's well above 33%. He didn't say why. My read is a cushion for costs and estimation error. When you work out your own break-even, include costs. Don't stop at the pure arithmetic.
An estimate, not a fact
In trading you never know your true expectancy. Of the four variables, average loss is the easiest to estimate because the initial stop is a definite price. Win rate and average win are the hard part. There are three ways to get at them:
- Backtesting. If you have historical data, count how often similar setups worked and what they paid.
- Forward testing. If you don't, start now on a sim account and log every qualifying setup.
- The long-run equity curve. Sloping down over a long stretch, you can be fairly sure expectancy is negative. Sloping up, the reverse.
Two more points. Expectancy moves, like a poker hand whose value changes with every card on the board, and markets evolve. And leverage doesn't create edge, it only amplifies whatever edge is already there. With negative expectancy, leverage just loses money faster.
The method: from a 20-trade table to +0.27R
Step 1: Freeze the setup definition
Example: a strong move up after the open, at least an hour of consolidation with higher lows, then a breakout to a new high of day. Entry on the breakout, initial stop at the low of the breakout candle, exit on a close below the 10-period moving average.
Every condition has to be visible before entry. Define the setup up front, then log every instance that meets it. A sample made only of the winners isn't a sample.
Step 2: Log continuously, losers included
Each qualifying instance gets a row: ticker, date, result in R.
First trade: breakout at $218, breakout candle low at $215, $3 risk per share, which is 1R. Price ran to $221, then closed below the 10-period MA; the exit filled at about $221. +1R.
Every loser is logged as −1R: the stop is always the breakout candle low, and this sample assumes every stop filled there. Winners vary because of the trailing exit.
Step 3: Calculate the four numbers
Here's a 20-trade sample I made up to demonstrate. Nine winners: 1, 1.7, 2, 1.2, 3.1, 1.5, 2.4, 0.9 and 2.6R. Eleven losers at −1R each.
- Win rate: 9 ÷ 20 = 45%
- Average win: 16.4 ÷ 9 ≈ 1.82R
- Average loss: 1R
- Expectancy: 0.45 × 1.82 − 0.55 × 1 ≈ +0.27R
In dollars: risking $100 a trade, you'd make about $27 per trade on average.
Step 4: Check it a second way
Add up all 20 results: winners total +16.4R, losers −11R, net +5.4R. Divide by 20 trades: +0.27R. Same as the formula. If the two don't match, something got copied wrong.
Step 5: Interrogate the number
People skip this step most often, and it matters most.
- Drop the biggest winner and recalculate. Take out the 3.1R trade: 19 trades, +2.3R total, expectancy +0.12R. More than half the result was riding on one trade.
- Find the break-even win rate. With a 1.82R average win, you need better than 1 ÷ 2.82 ≈ 35.5%. Overestimate your 45% by ten points and the edge is gone.
- Compare the first and second halves. Do trades 1–10 and 11–20 show similar expectancy? If it's only positive in the first half, the overall positive doesn't count.
- Split by a regime you can explain in advance. High vs low volatility, news vs no news. Pick the split before you look. Choosing it after seeing results doesn't count.
Twenty trades is too few for a verdict. The point of these checks is to see how fragile the number is. On real samples, the interrogation often tells the opposite story from the headline average.
Step 6: Write the next decision
There are only three options: keep forward testing, cut risk, or pause and version the rules. Write it conditionally. "20 trades, gross +0.27R, +0.12R without the biggest winner, sample too small, no size increase, keep logging to 50" passes. "This setup makes 0.27R a trade" fails.
More real cases
A profitable total that hid a bad half
A new trader was doing a lot of IPOs. Asked why, he said IPOs make money. On the totals, he was right: the category made $11,000.
Break it down. He made $30,000 on three hot IPOs and gave back $19,000 on seven weak ones. The three good ones averaged $10,000 each. The seven bad ones averaged a loss of a bit over $2,700.
If he could spot the weak ones in advance and skip them, the same category goes from $11,000 to $30,000, up more than one and a half times. And once it's split out, he can size up on the best type.
An overall expectancy is often the average of a few very different sub-groups. The average isn't wrong. It just blends something worth doing with something that isn't into one number.
Most of the profit from a tenth of the days
A veteran US equities day trader shared his 2024 stats. He made seven figures on the year, and in roughly 240 trading days, his best 24 days produced about 79% of the year's profit. His worst day lost only about $21,000.
Rough math: those 24 days took about four fifths of the year, and the other two hundred-odd days together took about one fifth. Spread across each of those days, that's small change next to the best ones.
This kind of skew is normal for mature traders, and it should grow as a trader goes from beginner to top tier. With a profit cushion and experience, when the equivalent of pocket aces shows up, they bet much bigger. A small worst day is a sign the risk system works: no averaging down, stops honored.
Beginners shouldn't expect the same skew. A younger trader a few years in felt he wasn't progressing. When he pulled his data, about three quarters of his trades netted out to roughly zero, and his best six or seven days produced more than all of his profit. That's exactly what a trader who's going to make it looks like at that stage.
The lesson for Step 5 is direct. Remove the best few days and the number shrinks a lot. That doesn't mean the strategy is bad. It means the expectancy lives in a thin tail, and you need to know how thick that tail is.
A win rate above 90% is a warning sign
A trader who posted daily P&L publicly had an impressive streak: 61 green days out of 64, about $430,000 made across the green days, and a displayed career win rate above nine in ten. Many winning days were $2,500, $4,000, $6,000. Then came a big losing day, and another the next day, one of them around −$190,000, close to 30 times a normal winning day.
For comparison, a veteran day trader's win rate last year was about 71%, and that was inflated by a batch of short out-of-the-money option trades. A price action trader he knows wins less than half the time. For this kind of strategy, a sensible range is something like 40% to 65%. So the first reaction to a rate above nine in ten shouldn't be admiration. It should be suspicion.
This lesson isn't judging anyone. It's using the numbers to make one point. The average green day was about $7,050 ($430,000 ÷ 61). In 100 trading days, 93 green days make about $656,000. If just 3 of the 7 red days are in the $250,000 range, losses hit $750,000 and the whole thing is negative. The problem isn't the 93. It's the size and frequency of the red days.
Another record that got passed around: 214 trades, seven figures of profit, a profit factor of 26, and a win rate of 89%. Profit factor is gross profit divided by gross loss. A rough yardstick: above 10 deserves suspicion, above 20 is close to fantasy. Plenty of consistently profitable pros sit between 2 and 5.
MULN: measure the risk first
On July 5, 2023, MULN put out a press release saying it would take action against "naked short selling." The stock had already slid from split-adjusted prices of $300, $350, $400 down to about 12 cents (all on the share count of that July). That January, GNS had gone from 50 cents to $5 and $7 after a similar move.
A veteran US equities day trader saw the release and didn't ask whether it would run like GNS. He asked what he stood to lose. His plan was to get out if it didn't move, costing maybe a penny or two plus commission; a gap down could cost more. The upside? He guessed a 10-cent move might be better than a coin flip, while admitting nobody ever knows the true odds.
Plug that into a simplified two-outcome example, a 50% chance of +10 cents and a 2-cent loss otherwise: 0.5 × 10 − 0.5 × 2 = +4 cents. Even if winners only made 5 cents, it's +1.5 cents.
The entry was the break of the day's high at 12 to 13 cents. The stock ran to 19 cents, pulled back a little and closed in that area. Still a good trade, even though it didn't keep going.
Most people start with "how much can it go up?" This case runs the other way: start with "what do I lose if it doesn't?" Risk is easy to measure. Measure it, then see if the reward stacks up.
Common mistakes
1. Treating expectancy as a forecast for the next trade. The coin table makes it plain: positive expectancy still leaves a 5.5% chance of being down after ten flips. Fix: after a losing streak, check execution and regime first. Don't rewrite the rules first.
2. Calculating from winners only. Picture someone trading five accounts in one day. One makes $4,000. The other four lose $2,500, $1,500, $3,000 and $1,000, for a net loss of $4,000. He can post a screenshot of the winner with "made $4K on NQ this morning." Every word is true and the impression is false. Fix: every qualifying setup goes in the same table, including the skipped ones and the losers.
3. Making win rate the goal. Nine-in-ten with one big loss can be negative. Two-in-ten with 5R winners can be positive. Fix: always read win rate alongside payoff.
4. Reading only the total. In the IPO case the total was right. Only the breakdown showed where the money came from. Fix: split at least once by a dimension you can justify in advance.
5. Optimistic estimates, then leverage. The 70% / $9 / $15 trade breaks even at 62.5%. If the true win rate is 60%, expectancy is 0.6 × 9 − 0.4 × 15 = −$0.60. Fix: build in a margin. The smaller the sample, the bigger the margin.
6. Mixing versions into one average. Change the definition once and it's a new version. Old samples don't get quietly relabeled, and old and new don't get pooled. Fix: one table per version.
7. Forgetting costs. The 70% / $9 / $15 trade grosses +$1.80. At $1 a trade in costs, net drops to +$0.80, less than half (Lesson 25 goes deeper). Fix: convert costs to R and log them per trade.
Where this breaks down
Expectancy suits repeated decisions whose rules can be written in advance and whose results can be recorded the same way every time. Average unrelated strategies together and the number means nothing.
Three situations make the number unreliable. The sample comes only from surviving tickers, or peeked at future data. The fills can't be replicated, like a backtest filled at ideal prices you'd never get in a real queue. Or there's an unknown, unbounded tail, which needs stress testing, not an average.
The number also expires. Participants, volatility and liquidity all change, so today's +0.2R isn't a permanent license. And it takes time to show up: many pros' cumulative equity curves look like rounding error for the first three or four years.
You can run the same math on habits. Journaling has positive expectancy. Revenge trading and staring at open P&L have negative expectancy.
Exercise: take apart a table that looks profitable
Material: at least 30 consecutive samples from your own replays or live trading, in original order. If you don't have them yet, do Part A.
Part A: by hand
- Heads +150, tails −50: find the expectancy per flip. Then heads +20, tails −10: what do ten flips make on average?
- 70% win $9, 30% lose $15: find expectancy and break-even win rate. What happens if the true win rate is 60%?
- Average win $420, average loss $210: find the pure-arithmetic break-even win rate. Compare it with the 40% rule of thumb and write one sentence on the gap.
- A record: 61 green days out of 64, $430,000 made across the green days, one red day of −$190,000. Find the average green day and write the first question you'd ask.
Part B: your sample
- Convert every trade to net R (after costs). Find net expectancy and total costs.
- Compare the first half with the second. No re-filtering.
- Drop the single biggest winner and recalculate. Record how much it shrinks.
- Split by one regime variable you can justify in advance.
- Write the next-stage decision: keep forward testing, cut risk, pause, or change the rules and start a new version.
Scoring (15 points):
- 3 pts: Part A is correct, and A2 says expectancy turns negative at 60%.
- 3 pts: Part B's sample is continuous, versioned, and has no deleted losers.
- 2 pts: costs are converted to R trade by trade.
- 2 pts: both the half-vs-half and drop-the-best checks are done.
- 2 pts: the regime split was chosen in advance.
- 3 pts: the conclusion is conditional and names a next step.
Answers: A1: +$50 per flip; ten flips +$50. A2: +$1.80, break-even 62.5%, −$0.60 at 60%. A3: 33.3%. A4: average green day about $7,050; ask how many red days there were, how big, and how size was set. Deleting losers or redefining the setup after the fact scores zero on the whole sheet.
Run your numbers through the Expectancy Calculator to double-check.
Tools for this lesson
- Expectancy Calculator: enter win rate, average win, average loss and costs for net expectancy.
- Trade Journal Analyzer: log in R and split the sample by period or regime.
- Risk Reward Calculator: see what win rate a payoff ratio needs to break even.
Where this leads
- Before this: Lesson 1 separated decision quality from outcomes, and Lesson 2 gave you R as a common scale. This lesson turns both into one number.
- Next: Lesson 4 shows how to rewrite an opinion as a hypothesis you can log like this. Lessons 25 and 26 cover backtesting without look-ahead and how many forward trades you need. Lesson 27 covers how the number decays.
- The sizing thread: position sizing in Lessons 13 and 15 is the practical side of "bigger edge, bigger bet."
Practice this lesson in NQ Replay
Expectancy needs a sample, and at 10x or 60x you can replay several sessions of one setup in an evening instead of waiting weeks for them live. NQ Replay is our own app for practicing on past NQ futures sessions, replayed tick by tick in simulation, with bracket orders, prop-style loss limits and per-trade review. You can request a free 7-day trial; you'll need your own licensed NQ tick data.
For educational purposes only. This is not financial advice and makes no promise of returns. Tickers, dates and market moves in real trade examples come from public sources. Individual P&L and record figures have been adjusted. Illustrative figures are the author's own. Trading involves risk of loss.
Test it in the calculator
Work out your net expectancy
What are your win rate, average win and average loss, and how much is left after costs?
Example: 45% win rate, 1.82R average win, 1R average loss, about +0.27R gross.
Open the Expectancy Calculator