
In one line: the regime isn't a forecast for the whole day. It decides what you're allowed to trade today and how big. Write it as a working hypothesis with an invalidation, and change it when the evidence changes.
Lesson 7 of the 30-part Trading Decisions course. By Eliza.
Lesson map
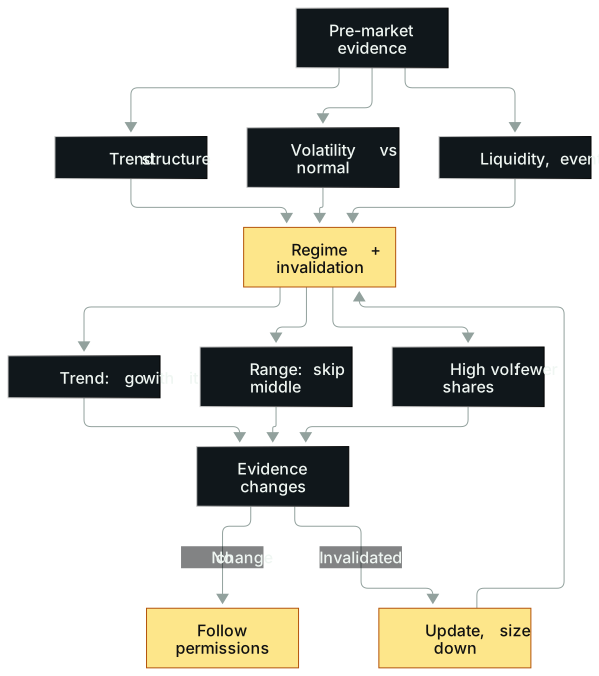
In words: Read it top to bottom: gather four kinds of evidence before the open, combine them into one regime hypothesis, and write its invalidation next to it. Each regime has a permission table. Intraday, update only when evidence changes, and the default update is to size down.
Opening: on panic day, others cut, he added
On May 12, 2022, US tech was collapsing. The richest pandemic-era growth names were hit hardest: TDOC, COIN, Beyond, Carvana, MSTR, even the ARK ETF. QQQ was weak too, but next to the frothiest corners it had a mild cold.
A veteran US equities day trader made a trade that day that he later reviewed in detail. The interesting part came before the open. Anticipating a possible panic day, he built a watchlist and drafted if-then plans with his trading group. His selection rule fit in one line: the most beaten-down names, the ones that had run highest and were now falling hardest. Apple and QQQ were still high in their multi-year ranges, so no. COIN and Beyond had just reported earnings, so no.
That left MSTR, Carvana and ARKK. MSTR had a float of about 10 million shares and traded 3 million that day, with a huge block at the close and a startling divergence from bitcoin; the market feared a margin call on its loans. ARKK was down 30% on the week, breaking 50 and sliding to 35, with huge liquidity and a diversified book (diversified is not the same as safe: market, concentration and liquidity risk all remain).
Then he waited for the turn. He was buying the reversal, not the decline. The trigger came from price: Carvana turned first, and almost at once ARK and MSTR broke their prior candle highs, filling his resting buy-stop orders. Carvana hit its limit up; Beyond and GME followed. Breadth was very strong, like a beach ball held underwater and suddenly let go.
Then came the key moment. Apple and QQQ were weaker and rolled over, and many young traders on the call got scared and started cutting. He didn't. He saw that while the rest of the market weakened, his names had made a higher low. Another veteran on the desk saw the same thing; both were pounding the table. A higher low and a fresh push up can be one candidate trigger for adding, if the plan defined it beforehand.
Exits followed the regime too. After several legs up and clear overextension, he sold most of it. When price broke the moving average that had been holding it, he closed the rest. He sold Carvana heavily at its limit up, which was in fact the top; it fell 6 points after.
Years later, he still said the key was stock selection: the most beaten-down names, not Apple or QQQ. In that review he stressed selection; picking the names does not guarantee the trade works.
The layer to notice here: every move that day started with reading the regime, then deciding what to do. Panic day, so pick the hardest-hit names. High volatility, so sell in pieces. New evidence (a higher low, stronger breadth), so don't cut with the crowd. A regime call isn't a forecast you hand in before the open. It's a line that evidence keeps redrawing.
The idea
The regime decides which distribution you face
Lesson 1 said a trade's outcome mixes your method's distribution with randomness. The regime is a third variable: the same method has a different distribution in different regimes.
Trends tend to reward breakouts and pullbacks with the trend. Ranges tend to punish chasing in the middle and reward fades at the edges (Lesson 6 covered why the middle has no edge). High volatility magnifies both: bigger opportunities, and bigger gaps, slippage and news reversals.
Macro conditions can go in a table too. The point isn't forecasting the economy. It's recognising what kind of tape you're in, so your trades match the opportunities that actually show up.
| Regime | More of | Worse for | Example |
|---|---|---|---|
| Low rates | Long momentum, active small caps and OTC | — | GameStop, AMC in 2021 |
| Inflation | Trades reacting to CPI releases | Long momentum; many turn net short | 2022, one print moving US stocks several percent |
| Elections and policy | News density; more M&A when regulation is loose | Less M&A under tight regulation | 2018 trade war to 2025 tariffs; the April 2025 tariff delay produced a one-day rally of nearly 10% in the S&P 500 |
| Strong economy | Momentum breakouts, IPO window, hot-theme news | — | CoreWeave, Circle IPOs in 2025 |
| Weak economy and market | Mean reversion in panics, offering news | IPOs, M&A | The August 2024 Nikkei panic |
The judgment behind it is blunt: when the money stops, it's often not the strategy breaking. The tape has switched to a different set of rewards.
Define a trend before you write rules about it
Most traders never ask what a trend is. A plain definition: a trend is price reaching new prices. In algebra, a slope: positive for uptrends, negative for downtrends, zero for ranges.
Without it, people keep trading ranging stocks and bleed out on small losses.
There's more than one way to define it:
| Method | Example |
|---|---|
| Slope | SPY long-term chart: positive slope with deep pullbacks |
| Highs and lows | A stock runs from about $48 to $64, pulls back to $53 for its first higher low, retests the highs, lifts the lows, then breaks out |
| VWAP | Nvidia holds above VWAP all day; momentum traders, funds and algos lean long |
| Moving average | FSLR holds its 20-week average for a long time, then breaks it; stopped out at $180, you watch it reclaim |
| Trendline | Bank of Hawaii follows a trendline all morning; when it breaks, a counter-trend starts fast |
| Reference price | AMD gets intraday breaking news; pre-news price $83.50. Holding above it means the market reads it as positive; losing it means trouble |
For downtrends: after FRC broke down, every bounce failed at the prior candle's high, which also served as the trailing stop.
Trends explode most easily when timeframes align. The textbook case is Tesla in 2021: $300 was huge resistance, price pulled back, made a higher low, retested, then broke out on an earnings catalyst. Weekly, daily and intraday breakouts plus earnings, all aligned. Shorts had stops at $300 and had to cover once it cleared. Big money and small traders were on the same side.
Signs a trend may be ending:
- A high-volume capitulation with price exhaustion. BABA was crushed when Xi Jinping was re-elected, on volume several times anything that year; everyone thought China was finished, and that extreme pessimism set up the reversal.
- Several consecutive legs, each bigger, still accelerating.
- Breaking news or a catalyst against the trend.
- Little or no consolidation. Consolidation means price acceptance; a trend without it has nowhere to catch its breath.
These won't show up every time. They become useful once you personalise and systematise why trends start and end.
Why trade with the trend: auditing every trade
How much a trend definition matters shows up in one self-audit. The veteran day trader, early in his career, already ranked near the top of his firm but was being dragged down by a few huge losses, over a million dollars combined. If he could eliminate the biggest ones, the rest of his results would jump. So he pulled every trade of his career and dissected them one by one.
The conclusion stung: the trades that made the most all ran with the larger trend and worked right away; the ones that lost the most were nearly all fights against it.
The classic counter-trend picture is GME's intraday chart on January 28, 2021: total collapse, wild volatility. You think it's oversold, buy at $210, and it drops another 100 points. The fix he adopted was to wait for a counter-trend, defined as a break of the prior candle's high, and buy inside that candle. Waiting for that cut his worst drawdowns sharply, one of the first changes that turned big losses into big wins.
High volatility is not a signal to size up
When volatility expands, the same share count carries more risk. During the week of the tariff shock, the high-volatility playbook came down to a few points:
- Use VIX to judge whether you're in a high-vol period, not VXX, which has decay and other quirks. Most people can judge it well enough by eye.
- Shorten holding times. Don't sit on a large stock exposure for long; it exposes you to news risk.
- Take the move in pieces, knowing it can reverse violently.
- Reduce unprotected overnight exposure and respect fat tails.
- When risk distance widens, size must shrink.
Shouldn't you bet more in times like these? High volatility is not a reason to raise your risk budget. Hold the dollar risk you planned, which may well mean fewer shares. A made-up example: you normally trade 36,000 shares of SPY on a 1% range day. On a 10% day, about 50 points, holding the same 36,000 shares through the whole move swings the account by roughly $1.8 million (36,000 shares move $36,000 per $1, so 50 points is $1.8 million; gross, before costs, not a planned loss). Your share count should fall so your dollar risk doesn't rise (Lesson 13 shows how to size from stop distance).
One high-vol setup worth understanding is buying panic. Here is how the loss structure compares, not a claim that it is the better strategy. A decline has a floor at zero. Buying needs no borrow and can't lose unlimited amounts to a runaway rally. In May 2022 one name fell from 70 to 34 on heavy selling, then exhausted. But a stock that fell from 70 to 35 can still fall another 35 and wipe out the money you put in. The floor at zero limits the loss on a fully paid long, it does not make the bounce likely or the trade positive-expectancy. Shorting a parabolic euphoria has no ceiling.
The method
Four lines before the open, then an invalidation
| Item | Question | Example |
|---|---|---|
| Trend structure | Are highs and lows stepping up or down? Holding VWAP, an average or a reference price? | Daily 20-day average rising; price above the pre-event reference |
| Volatility | Actual range vs normal? | Pre-market range already 3× normal |
| Liquidity | Volume and spreads normal? | First 5 minutes' volume below normal |
| Events | Any ongoing news source today? | Data at 9:30, a Fed speaker in the afternoon |
Combine them into one regime hypothesis and write an invalidation next to it, in price-action terms like Lesson 5's invalidation field. For example: if price drops back under where it was before the news and then prints a lower high, scrap "high vol, up" and switch to "high vol, down."
Three assignments go with it:
- List every way you define a trend, each backed by real charts and notes.
- Write the rules you'll follow in trends and in ranges. The big one: no counter-trend trades unless there's a genuine emotional capitulation and exhaustion. You have to write down what "exhaustion" looks like.
- Systematise the reasons you've seen trends start and end, in your own terms.
Turn the regime into a permission table
Once the hypothesis is written, give each regime a permission table: allowed, sized down, forbidden. This one is illustrative; fill yours from your own playbook.
| Regime | Allowed | Sized down | Forbidden |
|---|---|---|---|
| Trend | With-trend breakouts and pullbacks, trail at prior candle | Counter-trend reversals after a confirmed counter-trend | Fading just because "it's up a lot" |
| Range | Rejections at the range edge | In-range continuation, small size, two tries max | Chasing in the middle |
| High vol | Trading in pieces, shorter holds | Fewer shares, less overnight exposure | Treating share count as risk; bigger unprotected overnight positions |
| Panic | Buying the turn after a capitulation | Chasing once half the move is done | Catching the first half of the drop |
Two ready-made rules help put trends into the table. The VWAP rule: above VWAP, no shorts unless there's an extreme euphoric blow-off; below VWAP, no longs unless there's an extreme panic flush (Lesson 5 introduced it; this is its regime use). And a market filter used by a well-known momentum swing trader: 10-day average above the 20-day and both rising, good market; 10-day below the 20-day, be a bit careful; 10-day also turning down, more careful; both falling with the 10-day below, you probably shouldn't buy any breakouts.
Trend filters like this can whipsaw in ranges. Averages often fail in choppy ranges, and simple applications of such tools are one reason they can look useless in tests; that is the author's observation to verify, not an established result.
Update intraday only when evidence changes
Keep the pre-market hypothesis until its invalidation triggers or major new evidence arrives (breaking news, a key level lost). When you update, log the time and the evidence, and switch permission tables.
The default update is to size down. Flipping and doubling the moment the regime changes is how one misread becomes two.
More real cases
Macro panic days: the cleanest trends
Beginners badly underrate one use: trading opening-range breakouts in index instruments during extreme volatility, when macro events drive strong emotion. The 2025 tariff panic is the example.
In a panic, once the opening range breaks down, funds de-risk, momentum traders pile into shorts, hedging accelerates and trapped longs rush out, all at once. In a euphoric breakout, underexposed fund managers chase, shorts give up and retail arrives late. Fear creates urgency, everyone watches the same levels at the same time, and the move feeds itself.
The first 30 minutes after the open are a bit like Goldilocks: the market is deciding whether price is too high, too low or just right. Uncertainty peaks at the open and fades fast once price proves itself outside the opening range. On panic days that proof comes faster and harder.
So in high volatility, step one is asking whether today's volatility has direction: a clean trend or random jerks. Use the opening range for the first, size down for the second (Lesson 10 covers opening-range entries).
Circle: one rule to stay out of the way
Circle priced its IPO at $31, opened more than double that, and squeezed toward nearly $300. It was a focus stock for weeks, one of the richest opportunities of 2025.
In the most euphoric stretch, from $110 to $300, shorts got flattened. A simple rule kept you out of it: as long as it holds above the anchored VWAP, don't short, unless there's an extreme euphoric blow-off. Only on June 23, with a big blow-off day, could a short-side plan even become a candidate.
The rule cuts both ways. It keeps you away while the trend is against you and lets you in after a capitulation or reversal. It predicts no top. It only says what evidence you need before fighting the trend.
Up 100%, just getting started
Quantum computing stocks are the long momentum swing example: QBTS, RGTI, IonQ. In the last big speculative cycle, a stock already far up could double, then double again. Momentum, narrative and short covering together can produce absurd moves.
When a stock is already up 100%, a mean-reversion trader's instinct says it must be too late. In this regime the strongest leg may be just starting, or may already be over; the size of the move alone can't tell you which. It won't last forever. The 2021 meme mania was the same family: bankrupt companies valued above mature ones, buyers who liked the mascot, rocket emojis on Reddit. Extremes in human behaviour are often where a career's biggest trades come from.
In a trend regime, "it's up a lot" is no reason to short. In a panic regime, the same logic can make "it's down a lot" one input to a buy plan, never the whole reason. Both sides use the regime, not the price level.
The other end of panic: April 7 and the Nikkei
Looking back at the spring 2025 tariff crash in Nasdaq futures (NQ), the most important day on the chart is April 7. The NQ average sat at 19,500; that day's low was about 16,500, roughly 15% below it, almost unheard of for an index like the Nasdaq. Price was far below the lower Bollinger Band, and the speed rivalled the COVID crash. A trading psychology coach emailed traders that statistically the market was very likely to be higher a month later. A fake headline about a tariff pause was also circulating, but the market had already started bouncing before it. (Lesson 11 has the full exercise on the four key days.)
Charts can bottom before fundamentals do, partly because of emotion. When sentiment is at its worst and the pendulum has swung all the way, the room left is often up. Three kinds of evidence stacked up: speed, distance from the average, emotion. None of them predicted tariff policy.
An earlier case: the Nikkei panic around August 5, 2024, buying Nikkei futures into a violent panic in a weak market and holding for several days (Lesson 10 has details).
ETH had a day like that too: down 20–25% in a day, below the Bollinger Band, a full flush. It then bounced back to the 20-period average. That is a result seen afterward: it doesn't mean buying was right at the time, or that a similar drop will repeat it (Lesson 28 has details).
Common mistakes
1. Defining the trend forever with one indicator. FSLR held its 20-week average for ages, then broke it; stopped out at $180, you watched it reclaim. Trendlines too: the more touches, the more a line matters, but when price keeps touching without pulling away, a break becomes more likely. Fix: confirm a trend two or three ways, each with a stated invalidation price.
2. Adding shares because volatility is high. Holding 36,000 SPY shares through a 50-point move on a 10% day swings the account by about $1.8 million, gross. Fix: compute the dollar risk from stop distance, then the share count. Shorten holds in high vol and don't gamble on news with extra overnight size.
3. Repeatedly bottom-fishing because "it's already down a lot." Buying GME at $210 and watching it drop 100 more. Fix: wait for a counter-trend, defined as a break of the prior candle's high. If you're going to trade reversals, wait at least for predefined counter-trend evidence.
4. Using a macro view as an entry trigger. On April 7 the buy was based on price action: speed, distance from the average, intensity of panic. None of it was a bet on tariff policy. Macro views tell you how frequency, volatility and costs are shifting. They aren't a buy button. Fix: macro goes into the regime hypothesis; a trigger always needs a price and volume reaction.
5. Clinging to the old hypothesis after new evidence. The traders who struggled most in 2022 shared one trait: they were slowest and most stubborn about adjusting. Some had grown fast in 2020 and 2021, expected 2022 to repeat, charged in with long momentum and hit wall after wall. How do you become more like water? Match the market when it's fast; ease off when it's slow (Lesson 27 covers this drift). Fix: write the invalidation before the open, update when it triggers, and don't use morning profits to defend your bias.
6. Forcing it in the wrong regime. A few traders do remarkably well in their first year or two. Luck plays a part, but one common thread is that they focus on strategies that fit the regime of the moment. If the highest-expectancy opportunities this month are elsewhere and you keep repeating what isn't working, you've picked the wrong arena. Fix: once a month, list last month's best market opportunities and ask which regime they came from and whether your playbook has a page for it.
Where this applies
Regime classification is subjective. There's no single right answer, and others can argue. Its value is getting your judgment on paper where it can be tested.
The macro table is a historical summary. Which rates and policies favour which strategies changes over time; check against current data rather than old stories.
Trend filters (averages, VWAP) can whipsaw you in ranges; whether a rule works depends on its parameters, sample and costs. With a small sample, treat any regime label as a hypothesis, not a statistic (Lesson 26 covers building samples).
Practice: a ten-day regime log
Warm-up: May 12, 2022. Using only the opening story, fill in the four axes: trend structure, volatility, liquidity, events. Write one regime hypothesis and one invalidation, then a permission table: allowed, sized down, forbidden. Then answer: when the young traders on the call were cutting, did your hypothesis contain evidence strong enough to justify not cutting?
Steps:
- For ten trading days, fill in the four axes before the open with an initial regime and one invalidation.
- Intraday, update only when evidence changes, logging time and evidence.
- After the close, split the day into at most three phases and mark what was allowed, sized down and forbidden in each.
- After ten days, pick two misclassifications: a range you called a trend, and high volatility you mistook for high certainty. Write the signal that would have caught each earlier. Don't rewrite opening rules based on the final move.
Scoring (16 points):
- 4: ten days of four-axis logs, no blanks.
- 2: every initial hypothesis has a price-action invalidation.
- 3: intraday updates have times and evidence, no "felt different."
- 3: permissions and risk tiers really change with the regime.
- 2: the two errors get different correction signals.
- 2: the log shows you never treated big ranges as big conviction, or a macro opinion as a direction signal.
A whole day with only an after-the-fact label scores 6 at most.
Warm-up answer: the higher low, with the chosen names holding while the broad market weakened, is price evidence that can support not cutting, as long as the planned stop and portfolio risk limits still hold. An invalidation could be "breaks the trigger candle's low and loses the moving average."
On high-vol days, size from stop distance with the Position Size Calculator; when you hold several correlated names, check total risk with the Portfolio Heat Calculator.
Tools you can use
- Position Size Calculator: fixed dollar risk, wider stop, fewer shares.
- Portfolio Heat Calculator: total risk when you hold several same-direction names on a panic day.
How this connects
- Upstream: Lesson 5's setup definitions and Lesson 6's no-edge zones. This lesson places "range" in a broader regime map with a permission table for each.
- Downstream: Lesson 8 (timeframes and key levels) and Lesson 9 (news and events) expand the trend-structure and event axes; Lesson 13 turns "shares vs dollar risk" into a sizing formula.
- Side link: Lesson 27 covers strategy drift, spotting when your method stops working after the regime changes.
Practice this lesson in NQ Replay
Before your first trade in a replayed session, label it trend, range or high volatility, then check that label against the day's review afterwards. NQ Replay is our own app for practicing on past NQ futures sessions, replayed tick by tick in simulation, with bracket orders, prop-style loss limits and per-trade review. You can request a free 7-day trial; you'll need your own licensed NQ tick data.
For educational purposes only. This is not financial advice and makes no promise of returns. Tickers, dates and market moves in real trade examples come from public sources. Individual P&L and record figures have been adjusted. Illustrative figures are the author's own. Trading involves risk of loss.
Test it in the calculator
Volatility up? Cut the share count
How many times wider is your stop than usual, and what share size keeps the same dollar risk?
Example: $300 risk per trade. A $0.30 stop means 1,000 shares; a $0.90 stop means about 333.
Open the Position Size Calculator