
In one line: letting size follow opportunity is right, but it needs two locks. The right to size up comes from telling a good hand from a bad one before you trade, and the only reason to add is new evidence from the market, never a lower price. Write your cut rules before the winning streak, not during it.
Lesson 15 of the 30-part Trading Decisions course. By Eliza.
Lesson map
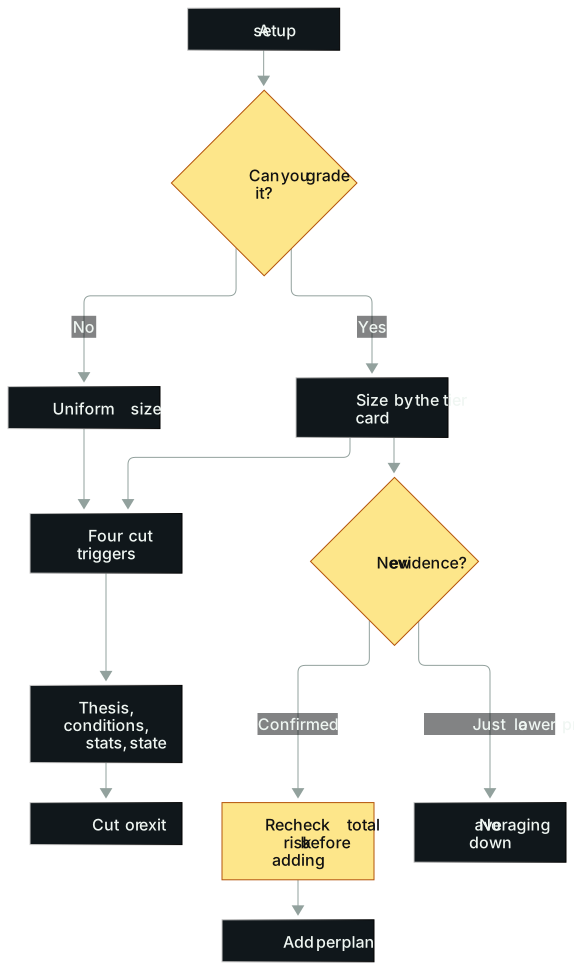
In words: (1) Every setup starts with one question: can I tell, before I trade, whether this is ordinary, very good, or a once-a-month opportunity? (2) If not, trade uniform size, and still follow the four cut triggers. (3) If so, size it by a tier card written in advance. (4) Once the position is on, ask whether the market has produced new evidence: if it confirms, recompute total risk first, then add per plan; if all you have is a lower price and an open loss, averaging down is off the table. (5) Before every add, recompute the risk of the whole book, then update it after the fill. (6) Four kinds of cut triggers are written in advance: the thesis breaks, conditions get worse, recent results deteriorate, or your own state slips. Any one of them means cut or exit.
Opening: same trades, he wins, I lose
A veteran trader tells a story from his first job. He sat next to his boss, an excellent trader with weak risk management and a very real edge, especially when he was holding a strong hand. His approach back then was simple: whatever the boss does, I do.
The result was the same every day. At the close the boss was often up big and he was down. Same trades.
Eventually he worked out the difference, and he put it in poker terms. The boss lost on junk hands like five-jack too. But when he was dealt pocket kings, or ace-king, he bet much bigger. On an exceptional trade he didn't add a little; he multiplied. Meanwhile the young trader bet roughly the same on everything. That alone was enough to flip the result.
He also talks about another new hire from his class. This guy had a real edge, especially trading breaking news, with absurdly fast reactions. But he never sized up. One year, two years, three years, still trading the size he started with. What he made never covered the ordinary mistakes everyone makes, and eventually he didn't make it. It wasn't that he lacked an edge. His edge never got multiplied by size.
Put the two side by side: one trader's size followed the opportunity, the other's never moved. The first made money. The second washed out.
That's only half the conclusion, though. "Let size follow opportunity," with no conditions attached, turns into chasing and averaging down, and that washes people out too. This lesson covers the other half: what earns you the right to size up, and when you have to pull it back in.
The idea
The right to size up: telling good hands from bad
In poker, pocket aces come once every 221 hands, under 0.5%, and win about 85% of the time against a random hand. Junk like nine-two doesn't win even 40%. Bet the same on both forever and you'll struggle to leave the table ahead, because you never cashed in on the rare good hands.
Trading works the same way. Junk and ordinary hands vastly outnumber the good ones. Plenty of strong traders will tell you a big chunk of their annual profit comes from a small fraction of their trades. That's experience, not a statistical result, but it points the same way as Lesson 3's numbers, where the best 24 days produced about four fifths of a year's profit.
There's a heavy precondition: this isn't for beginners. It requires grading, before you trade, whether this one is ordinary, very good, or the trade that makes the month. If you can't do that yet, use uniform size and build your core setups and consistency first.
A trader who makes seven figures a year gave a sharper example. He runs an intraday strategy fading gap-ups and puts the same amount on every time. His reason: he can't tell how much better one instance is than another. He only knows the whole set has positive expectancy, since most of those gaps eventually fade. If he can't tell them apart, he can't put a fortune on one and pocket change on the next. In the setups he truly specializes in, he has built enough judgment to scale by grade.
The bottom line is blunt. When you can tell good from bad, scaling by grade is mathematically better. When you can't, uniform size is correct. A lot of confusion comes from mixing those two situations up.
Add only on new evidence
There's a second route to more size: the position is on, the market gives you new information, you add.
There's a trap here, and breakouts show it most clearly. Price presses against resistance and breaks for the first time: point A. It breaks but doesn't get away, and drops back to resistance: point B. It bounces a little off resistance and comes back again with a lower high, twice failing to push through: point C. Plenty of traders see price come back and think, great, the same chance again.
It isn't the same. Based on data that trader collected himself, C is worse than B, and B is worse than A. So he builds the full planned size at A, uses less at B, and less still, or nothing, at C. Price returned to the same number. What's known has changed, so the expectancy has too.
Breaking news works the same way. The headline hits, you buy at A, then there's a deep pullback and the original price shows up again. People who missed A think they get another shot, and they often get run over. Genuinely good news, and genuinely good trades, move in the expected direction. Pullbacks stay shallow, and higher highs and higher lows keep coming.
For adding, the rule fits in a sentence: a lower price is not evidence, and an open loss is not evidence. Evidence is something new and observable that makes the original thesis more likely.
Why size-up rules need cut rules
The danger after sizing up is that your own good results start pushing you around. The most common path inside trading firms looks like this:
- You hesitate and miss the first chance.
- You catch the second wave and make decent money.
- Confidence builds. On the third and fourth trades you size up and make more.
- Your brain recalibrates. By the fifth and sixth, size is badly oversized, you're euphoric, and you're sure you can't miss.
- Meanwhile the opportunity has become crowded and overextended. Quality is falling.
The stretch when trading feels easiest is often when it's most dangerous below the surface. The brain overweights recent results, so a few smooth months start to look like the new normal. On a streak, every dip will bounce and every setup will work, so you press harder exactly while risk quietly piles up. Some of the most dangerous moments in trading come at peak confidence, not peak fear.
So cut rules get written before the streak, and the streak's mood isn't allowed to rewrite them.
The method
1. Grade setups with a tier card
That veteran trader keeps a card on his desk with A, B, C and D on it. D means no trade. The risk for each tier is written next to it. To size up, he edits the card, and he looks at it deliberately every day.
- A: once or twice a month, the trade you'll still remember at year-end. Size up a lot, by multiples.
- B: dozens a month, possibly one of the day's best few.
- C: everyday stuff, slightly positive, like a small probe.
- D: mediocre, a coin flip, something you drift into out of boredom that probably loses after fees.
His sizing example (figures adjusted): judged live as a B, he takes about $7,500 of risk. If he suddenly realizes it might be the best trade of the month and liquidity allows, he multiplies, up to about $75,000 of risk. That's planned risk, not position value.
The progression goes: uniform size first; then linear, say $80, $120, $160; only then multiples, say $80, $160, $320 (the same numbers as Lesson 13). The card's value is that it makes you answer one question before every order: does my size match this tier? Too small? Too big?
2. Size up the easy money first
The traders who improve fastest often use a barbell. On one end, the easy-money trades: frequent, low-volatility, repeatable, the singles you keep hitting. On the other, the few home runs a month.
The first place a newer trader should add risk is the singles, not the home runs. The reason is practical: if those trades make you double your usual month, your cushion is thicker and you can absorb a lot more. Think free throws. If it's your most reliable shot, you want it worth two points, not one.
One young trader got there exactly that way. He stacked a few hundred to a thousand dollars a day on very short-term trades, then used that profit to fuel the few big opportunities each month. A senior trader made him a deal: make your first six-figure trade and we're going for steak. Before long, they went.
3. Write adds as a plan, triggered by new evidence
Before entry, write your add conditions as if-then statements, each one observable and checkable. An example, our own numbers:
- Starter position 0.5R.
- Add another 0.25R only if the breakout retest holds above the range and volume picks back up.
- Whatever happens, total planned loss on the trade stays at or under 0.75R.
If price confirms, add per plan. If price falls back into the range on heavy volume, the thesis has weakened and the rule says exit. Adding 0.4R at that point to lower your average is averaging down triggered by an open loss. It is not a planned add.
Before every add, recompute total risk: current holdings, correlated names, slippage, overnight and gap scenarios. What's the worst planned loss? One swing trader watches two things at once: the loss stays within 1R, and the position stays within a tenth to roughly a seventh of account capital, a fifth at most. The thing he least wants to do is put half the account into one stock because the stop only risks a fraction of a percent. Open profit isn't free risk either. Moving a stop to what looks like breakeven leaves gaps and correlation right where they were.
4. All at once or in pieces?
Several strong traders share one principle: build the full position when expectancy is highest. Don't wait until price has run, risk has grown and the reward has shrunk. Breakout buys usually go in all at once, because the breakout price is the whole point.
Shorting a parabolic run is different. It's like an oncoming train: first confirm it's slowing, wait for it to stop or reverse, then add up to full size while you're already in profit. Once the turn is confirmed and expectancy is rising, adding makes sense. When expectancy starts falling, size should shrink. At zero, nothing stays.
5. Four kinds of cut triggers
One example each:
- Thesis. Key structure fails, the catalyst is refuted, price reacts against expectations. Points B and C above belong here: price didn't get away, so expectancy has already changed.
- Conditions. Volatility, liquidity, halts, overnight or event risk go up. A swing framework might read (our numbers): portfolio down 6% from peak, halve everything; down 12%, exit all non-core holdings and go mostly to cash; no single position over 15% of the book; halve overnight exposure before earnings, a Fed meeting or an election.
- Statistics. Recent win rate, payoff or opportunity count drops. One trader didn't cut size when the market slowed; he cut a month's trades from 40 to 12 (Lesson 27 covers this).
- State. Sweating, a sinking stomach, praying, breaking the plan. A useful move is to cover 100 shares first, like cracking a pressure valve, then 4,000, then 8,000 (Lesson 16 covers this).
There's one more kind of cut people rarely mention: opportunity cost. Swing traders holding five or ten positions tie up capital for days, weeks, even months. With a fifth of buying power sitting in a decent trade and an outstanding setup appearing elsewhere, you have to choose: keep, trim or exit, comparing what's left of the current trade's expectancy against the new one. Pure day traders get their buying power back every evening and aren't used to thinking about this.
More real cases
May 12, 2022: others were cutting, he was waiting for higher lows
The market had fallen for days and panic was everywhere. That veteran trader was running a swing-trading group that day. Before the open he had a watchlist and an if-then plan written, and he warned the group it might be a big day.
After the open he saw Carvana turn first. Almost at the same moment ARKK and MSTR broke their prior-bar highs, triggering buy-stop orders he had already placed. Then Carvana hit limit up, and Beyond Meat and GME followed. That's a strong breadth signal.
Then Apple and QQQ weakened and turned down. Many of the younger traders in the group got scared and started cutting. He didn't. What he saw was that the rest of the market was weakening while the daily charts of what he held looked much better, putting in higher lows. By his rules, a higher low followed by a move back up means add.
The execution was a string of small moves: buy where MSTR turned; add at the breakouts while Apple and QQQ weakened; sell some, add it back; sell most of it once price ran up repeatedly and was clearly overextended; flatten everything when it broke the moving average that had been holding it. When Carvana hit limit up he sold a big block right there. That was the top; it fell about 6 points afterward.
Adding and cutting in this case used the same ruler: expectancy. The others cut on emotion. He added on a new piece of evidence, his stocks not weakening with the market, and he sold because Carvana was overextended and the risk-reward had turned. He'd planned to hold all day, changed course live, and wrote the reason for the change into his review.
Seen it five times before sizing up several-fold
An old colleague, known for trading rarely and making a lot, moved from one city's office to another and his results jumped. Asked whether it was mostly size, he said yes, mostly size, but also the new office had a trading floor, that energy, more eyes on the market. Before, he'd had to find most opportunities on his own. Now there was a running discussion about the few that mattered most right now. Seeing the whole board made him more willing to size up.
His bar was specific. A setup had to be seen two, three, four, five times, written into the playbook and organized before he'd trade it at several times the size he'd once found comfortable. The only way to get there was constant review, with other people around to review with.
That's a footnote to the word "right." The right to size up comes from repetitions and from someone checking your work, not from a feeling.
Doubling in one jump during a streak
The swing trader from Lesson 13 spent the first half of 2025 raising every tier steadily, about a tenth at a time. But A+ setups only come one to four times a year for him. On the Circle (CRCL) trade, he took A+ risk from about $34,000 straight to about $68,000, never having actually traded the tiers in between. By his own account it went terribly, because the emotional groundwork wasn't there.
A 100% jump is something almost no trader adapts to easily. The rule of thumb: don't raise size so sharply that a loss damages your psychology and your feedback loop, or changes how you handle the trade. Worse, a lot of people take that hit and learn the wrong lesson: sizing up isn't for me. The right lesson is that the step was too big (Lesson 18 covers stepping up).
The day after the best day
It's worth looking at the flip side of sizing up one more time. A small-cap trader shorted Avis after its frenzied top and had one of the best trades of his career. The next day he gave almost all of it back in another stock, one whose setup was nowhere near as good as Avis.
The most dangerous moments in a trading career often come not when you're losing but when you're winning. Size up because of the quality of the opportunity, not because of how much you made yesterday (Lesson 19 covers this).
Common mistakes
1. Treating an open loss as a reason to add. Lower price, lower cost, feels like a better deal. On January 28, 2021, the day GME crashed, some traders thought it had fallen too far and bought around $210. It then fell about another 100 points. Better: wait for the reverse trend to form, say a break of the prior bar's high, and accept missing part of the move. Severe drawdowns drop a lot (Lesson 10 covers this). Fix: write adds into the entry plan, with new market information as the only trigger.
2. Hiding fat-tail losses behind a high win rate. The more you average down, the easier long winning streaks become, while losses pile into a few extreme moves. The trader from Lesson 14, 36 green days and then a loss of about $190,000 in one day, showed a win rate above 90%. That's exactly the warning sign. Price-action traders typically win somewhere between 40% and 65% of the time; one veteran's win rate in a good year was around 70%, and that was inflated by selling a lot of out-of-the-money options. When a win rate looks absurdly high, ask first whether the losses are hiding in a handful of extreme days. Fix: look at average loss, maximum loss, and whether there's a defined stop in strong trends, not just win rate.
3. Jumping several tiers on a rare setup. The Circle trade above. Fix: one tier at a time, and get used to the new tier on the frequent, ordinary trades first.
4. Same price, same opportunity. Price returns to where it was, so it must be a second chance. Points B and C are worse than A and deserve less size, or none.
5. The market slows and your size and frequency don't. Fewer opportunities is itself a statistical cut trigger. Fix: cut frequency first, like the trader who went from 40 trades a month to 12.
6. Copying someone else's percentages. Plenty of veterans use no quantitative sizing formula at all, Kelly included. Two reasons: it demands win-rate and payoff estimates more precise than most traders have, and a size that's mathematically optimal for one person can be psychologically unbearable for another. A model only helps if you can keep following it.
Where this applies
This lesson assumes you already have a steady, continuous sample and can grade setups before you trade. Without enough sample, uniform size is the safer choice.
An A+ setup that shows up a few times a year shouldn't double just because your ordinary size has gone up; you need time on the tiers in between. Some trades suit building all at once (breakout buys), others suit scaling in (shorting parabolics). There's no single answer.
Be honest about one more thing: this approach's upside is also its risk. On the Nikkei trade in Lesson 10, the trader used his full allowance, but he knew he could get out. That was controlled discomfort. If your conviction comes from a feeling rather than a sample, sizing up is just betting.
Forex and CFDs work the same way, but check two more things before adding: margin usage and overnight financing. Adding to a CFD position raises margin usage at the same time, and if several pairs in your book are all really dollar trades, what looks like several positions is one big one. Before weekends and major data releases, raise the bar for adding.
Practice: a two-branch sizing decision tree
Material: pick a setup you have a continuous sample for. If you don't, use this lesson's points B and C (the second and third return to resistance after a breakout).
Steps:
- Draw two branches. Confirmation branch: two pieces of new evidence (observable only), the risk at each tier, the portfolio's invalidation point, total risk and a liquidity check. Deterioration branch: four cut or exit triggers, and the conditions under which adding is forbidden.
- Blind-test three historical cases: one that confirmed and continued, one that confirmed and failed, one that failed without ever confirming. Hide the final P&L and decide using only what was known then.
- In tier-card form, write your own A, B, C and D tiers and the risk for each.
Scoring (out of 14):
- 3 points: setup grades are backed by continuous evidence.
- 2 points: both confirmation conditions are observable.
- 3 points: total risk and correlated exposure can be calculated.
- 3 points: all four kinds of cut trigger are present.
- 2 points: liquidity and behavior boundaries are written down.
- 1 point: no hindsight used in the blind test.
If either branch allows unlimited adding after a loss, the exercise fails.
Reference: Adds must be triggered by new evidence, with total risk recomputed at every step. The "confirmed then failed" case can still be a rule-following trade. For the "failed without confirming" case, the answer has to be exit; a lower price is never a reason to add.
Before adding, first turn each position's stop distance, size and point value into planned risk as a percent of equity, then enter those percents in the Portfolio Heat Calculator. Use the undiscounted total to check the loss if everything stops out at once (a correlation-adjusted figure is not the worst-case cap). If you're tempted to add lower, run it through the Average Down Calculator first to see the new average and total quantity (stop-loss risk must be calculated separately), then ask whether this is a planned add or averaging down. Size the new piece with the Position Size Calculator using the budget you have left.
Tools you can use
- Portfolio Heat Calculator: total loss if every position hits its stop together.
- Average Down Calculator: new average cost and total quantity after adding; stop-loss risk must be calculated separately.
- Position Size Calculator: size an add from your remaining budget.
How this connects
- Upstream: Lesson 13 covers per-trade risk and sizing; Lesson 3 covers expectancy. This lesson turns "better setups deserve bigger bets" into rules for adding and cutting.
- Downstream: Lesson 16 covers forced de-risking after a limit is hit; Lesson 18 covers rebuilding size in stages.
- Psychology: Lesson 19 covers outcome attachment after a streak, which expands on this lesson's "peak confidence is the most dangerous point."
Practice this lesson in NQ Replay
Rehearse your add and cut rules on replayed sessions, where an add that breaks the plan shows up in the review instead of in your account balance. NQ Replay is our own app for practicing on past NQ futures sessions, replayed tick by tick in simulation, with bracket orders, prop-style loss limits and per-trade review. You can request a free 7-day trial; you'll need your own licensed NQ tick data.
For educational purposes only. This is not financial advice and makes no promise of returns. Tickers, dates and market moves in real trade examples come from public sources. Individual P&L and record figures have been adjusted. Illustrative figures are the author's own. Trading involves risk of loss.
Test it in the calculator
Before you add, check how hot the book is
If every position hit its stop at once, what would you lose in total?
Example: three same-theme stocks start at 0.5R each; after confirmation one of them adds 0.25R: about 1.75R worst case. With a 2.5R daily cap, the next trade gets 0.75R at most.
Open the Portfolio Heat Calculator