
In one line: backtests die two ways, peeking at the future and leaving out costs. Freeze the rules first, collect samples continuously, look at the holdout once, and write costs into the rules. A pattern you found after the fact is a hypothesis, not evidence.
Lesson 25 of the 30-part Trading Decisions course. By Eliza.
Lesson map
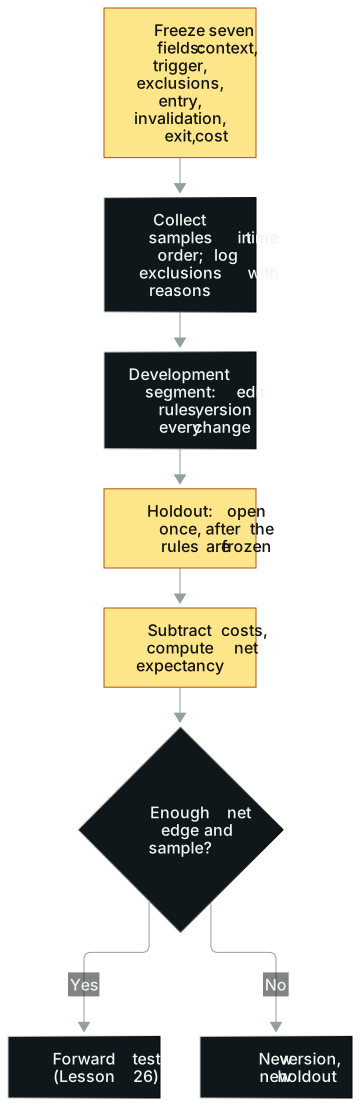
In words: (1) Before you start, freeze seven fields: context, trigger, exclusions, entry, invalidation, exit and cost. (2) Collect samples continuously in time order, and write down a reason for every case you exclude. (3) In the development segment you may change the rules, giving each change a new version number. (4) Open the holdout only after the rules are frozen, and only once. (5) Subtract costs and compute net expectancy. (6) If net expectancy and sample size both pass, move to forward testing in Lesson 26. If not, build a new version and use a fresh holdout.
Opening: hundreds of hours for one word, "thin"
A trader once said he knew exactly one person who made consistent money betting on sports.
That friend didn't bet on gut feel. He spent hundreds and hundreds of hours building his own quantitative model and backtested it over years. The model fed on a human weakness: people mistake randomness for pattern. When a team was on a winning streak, he leaned toward betting against it. When a team was on a losing streak, he leaned against that too. But only in very specific situations, each one backed by data.
The result? The model really did make money consistently, and it gave him a decent side income. That was it. After the bookmaker's cut and the spread, the edge was shockingly thin. He had to bet big and sit through deep drawdowns to earn that money, and it barely scaled.
Notice how honest that ending is. Run the same model without the vig and the curve looks far prettier, pretty enough to make you quit your job. Because he counted costs, the verdict was one word: thin.
Backtests die two ways. One is leaving out costs, which this friend avoided. The other is quieter: peeking at the future. This lesson covers both.
The idea
Peeking isn't just scrolling one bar too far
Most people think look-ahead bias means accidentally advancing the replay a bar. The real doors are more numerous and better hidden.
Door 1: defining things in hindsight. New traders often play Monday-morning quarterback: every winner was a trade they "should have taken," and every loser gets filed as overtrading. But what is overtrading? Failing to follow the playbook you wrote in advance. The key word is "in advance." Put the definition after the outcome and anything can be explained.
Door 2: draw enough lines and one will look smart. Lesson 4 covered the Fibonacci thought experiment: flip the chart upside down, redraw the retracements, and you'll still find "levels that worked." Backtest every horizontal line you casually drew on a random set of stocks and you should expect a pile of noise.
Door 3: using information you didn't have yet. News is the classic case. With fresh major news, moves tend to continue; a big, fast move with no news is more of a mean-reversion candidate. Backtesting without separating the two is like scoring poker hands on who won without looking at the board. It ruins the whole data set. The probabilities differ completely between the two regimes, and averaging them could make you throw away a strategy that actually works on news breakouts.
This door has two traps. One is forgetting the variable. The other is tagging too late. "Was there fresh major news at entry?" must be answerable at the moment of entry, not filled in after you've watched the move.
Door 4: picking samples. Include as many trades as possible that meet your predefined conditions. Don't pick them to get the result you want.
Door 5: tuning and validating on the same data. Try a dozen parameter sets and report only the best, and you're solving the test with the answer key open. Once the rules were changed while looking at results, that data is no longer new data.
Dissecting charts after the fact: good for hypotheses, not proof
The NQ chart quiz in Lesson 11 is a fine example of after-the-fact dissection: pick the four key days with the outcome in view and write a reason for each. You can do the same with the panics of 2008, August 2015 and August 2024, finding the turning days and building material for your trend reads.
When you read the reasons, split them into two kinds. Some are visible at that day's close: speed of the drop, distance from the moving average, volume, how many down days in a row. Others are only known later: news that came days afterward, the gap that news created. The first kind can go into rules. The second kind is background only.
The futures trader in Lesson 5 spent a full year marking the "easy pullback-to-VWAP trade" every day. That's after-the-fact labeling too, and as a way to learn a pattern it's fine. The trouble starts at the next step: take those hindsight-labeled samples and announce "this rule wins 80% of the time," and study material has been passed off as evidence.
If you want evidence, hide the answer. Write the rules first, then reveal the outcome.
What backtesting and forward testing each answer
A backtest studies similar past cases, computes the success rate and average profit, and asks whether that historical sample made money overall. A forward test starts today, on a simulator or small size, finds cases that meet predefined conditions, and records and computes as it goes. Both rest on one shared requirement: conditions are set before you see results.
Backtesting is convenient because the data already exists, and that's exactly why it's easier to peek. Forward testing can't be peeked at, because the future hasn't happened yet (Lesson 26).
The method
1. Freeze seven fields first
Before collecting any samples, write these down and save them:
- Context: which market, session and backdrop qualify (Lesson 5).
- Trigger: exactly what has to happen before you enter.
- Exclusions: what clearly doesn't count.
- Entry: how you get in.
- Invalidation: the price or condition that makes you wrong.
- Exit: how you get out.
- Cost: estimated spread, commission and slippage per trade.
Every change gets a new version number, and results from old versions stay as they were. Never stitch v1 and v2 into one equity curve.
2. Sample continuously, exclusions included
Building a screenshot library is the groundwork: sort by setup and store it in your own notes app. Get to at least a dozen-plus charts, ideally far more, before you start studying variables, entries, stops and targets. Meaningful risk goes only to setups with data behind them.
Add two disciplines. Collect samples continuously in time order, without skipping to the "pretty" ones. And log a reason for every case you exclude. Otherwise a bad outcome quietly becomes a case that "didn't count," and a good one becomes a trade you "would have taken."
3. Development and holdout
Split the data in two. The development segment is where you form and revise rules; change them freely and version every edit. The holdout opens only once the rules are frozen, and you look at it once.
If the holdout disappoints and you go back to tuning, it can no longer be called unseen data. You can build a new version with a new holdout period, but admit the old validation has been spent.
4. Take costs out completely
Here are our own numbers (Lesson 3 covers the expectancy math). A breakout rule wins $9 per share 70% of the time and loses $15 the other 30%. Gross expectancy:
0.70 × 9 − 0.30 × 15 = 6.30 − 4.50 = +$1.80
Now assume $0.80 per round trip, covering spread, commission and slippage. The figure is chosen to show scale and doesn't match any broker's pricing; swap in the real number from your statements and the method stays the same.
You pay costs on every trade. A winner becomes 9 − 0.8 = $8.20, and a loser becomes 15 + 0.8 = $15.80.
- Net expectancy = 0.70 × 8.2 − 0.30 × 15.8 = 5.74 − 4.74 = +$1.00
- Subtracting directly gives the same result: 1.80 − 0.80 = 1.00. An $0.80 cost ate 44% of the edge.
Costs also raise the breakeven win rate. Without costs, p × 9 = (1 − p) × 15, so p = 15 ÷ 24 = 62.5%. With costs, p × 8.2 = (1 − p) × 15.8, so p = 15.8 ÷ 24 ≈ 65.8%. A 70% win rate's cushion above breakeven shrinks from 7.5 points to 4.2. Overstate the win rate by 5 points in the backtest and the rule loses money after costs.
Push costs up a few more notches:
| Cost per trade (assumed) | Net expectancy | Breakeven win rate |
|---|---|---|
| $0 | +$1.80 | 62.5% |
| $0.40 | +$1.40 | about 64.2% |
| $0.80 | +$1.00 | about 65.8% |
| $1.80 | 0 | 70.0% |
At $1.80 per trade, net expectancy hits zero, and the entire edge goes to the broker and the other side. Once an edge is thin enough, costs are the referee. The sports bettor's model lives in the bottom half of this table.
5. Results should be independently verifiable
A backtest is for you. A track record is for other people. At minimum, someone else's record should come from real broker statements or from verifiable third-party checks and audits. Many journal tools let users import trades from a spreadsheet, so a screenshot alone proves nothing. The more extraordinary the claim, the harder the evidence needs to be.
More real cases
A curve too good to be true
Lesson 3 took apart a track record that was making the rounds: a profit factor of 26 and a win rate near 90%. The yardstick still holds. A profit factor above 10 deserves suspicion, and above 20 is close to fantasy. Win rate and profit factor also tend to move in opposite directions. One verified top day trader has said he isn't sure his win rate ever topped 60%, and his profit factor is definitely under 5.
Use the same yardstick on your own backtests. The day yours prints a profit factor of 20, hold the celebration and check all five doors to see which one you walked through.
Hand over every trade before the interview
A day trader was chosen for a well-known collection of trader interviews. Before any interview, he had to pass a full audit: every trade record, from both the firm account and his personal accounts, compiled into a spreadsheet to estimate annual returns. As he understood it, they wanted at least ten years of results, and both steady profiles and high-volatility, high-upside profiles qualified.
The finest detail was normalizing the basis. At the firm he traded on buying power, which isn't the same as what most people call capital, so it had to be adjusted. Only after the audit passed did the interviews begin.
That's the template for how other people verify your numbers: every record, a long enough history, one consistent basis. Hold your own backtests to it as well.
A 90% win rate that wore thin
The first-red-day short seller from Lesson 13 once pressed that setup very hard. Through pattern recognition, backtesting and his own stats, he found it worked well over 90% of the time, so he sized up, and that's where he learned dynamic sizing.
Then he added that by now most people have figured it out, and it has lost a lot of its punch.
That's the last lesson of backtesting. Samples belong to the past, and markets change. A rule with a 90% historical record carries no promise for today (Lesson 27).
How one news tag contaminates a whole data set
Imagine a backtest with our own numbers: 100 "sharp drop with no news, then bounce" cases where buying the dip won 60% of the time, mixed with 40 "sharp drop on major bad news" cases where it won only 30%. Combined, 140 cases win about 51% (72 ÷ 140). It looks like a coin flip, and you may well throw the rule away.
The opposite error is just as common. Fill in the "news or not" column after watching the move, and the drops that bounced tend to get tagged "no news" while the ones that kept falling get tagged "news." The tag itself peeked at the outcome, and the "no news" group's win rate comes out inflated.
Both errors have the same fix: set the tag before entry and write the definition into the exclusions.
Common mistakes
1. Saving only the winning screenshots. A folder of winners always looks more "patterned" than a folder of losers. Fix: everything that meets the predefined conditions goes in, including exclusions and failures, winners and losers in one table.
2. Using hindsight tags to define entries. Was "big news that day" added after you watched the move? Fix: for every tag, ask whether you could have known it at the moment of entry.
3. Tuning and validating on the same data. Fix: edit in development, view the holdout once, and switch to a new holdout after any change.
4. Ignoring costs. In the example above, an assumed $0.80 cost ate 44% of the edge. Fix: write costs into the frozen fields, no exceptions.
5. Adding parameters without counting attempts. Try a dozen and show only the winner, and you're calling luck skill. Fix: log a version and a count for every change, and write "how many tries" into the strength of the evidence.
6. Treating chart dissection as evidence. Choosing key days is subjective, as the person who set the quiz admitted. Fix: after-the-fact analysis produces hypotheses only. Write them into the next version and test on unseen data.
Where this applies
A backtest answers one question: how did these written rules perform on this stretch of history? It can't prove the future, and it can't replace a forward test (Lesson 26). When the market regime changes (Lesson 27), old conclusions get discounted.
The smaller the sample, the less confidence you get. A dozen-plus charts is a starting point, nowhere near a passing grade.
When a trade depends on one-off information that can't be repeated, backtesting is meaningless. A rumor known to only a few people has no historical counterpart. Size down or pass. Manufacturing a curve is self-deception.
FX and CFD traders should check two more things. First, backtests often use average or minimum spreads, while real spreads can widen several times over around data releases, the Monday open and thin hours, so the cost field should reflect the hours you actually trade. Second, overnight financing (swap) is charged or credited daily, and a strategy that holds for days will look systematically better than it is if you leave it out.
Practice: a 20-node blind replay
Step 0: warm-up
Pick a historical decline you don't know well. With the outcome in view, choose its four key days and write one reason for each. Then mark each reason as visible at that day's close (speed, distance from the moving average, volume, a break of a level) or known only later (subsequent news, a later gap). Count how many of your four days relied on the second kind.
The exercise
- Choose a historical stretch you haven't memorized.
- Freeze the seven fields (context, trigger, exclusions, entry, invalidation, exit, cost) and save a timestamped file.
- Replay bar by bar and find 20 signal nodes. At each one, save the screenshot, your call and the version number before the outcome is revealed.
- The first 12 are development records; you may change the rules based on them, with a new version each time. The last 8 are the holdout check; once you've seen them, no more rule changes.
- Write the conclusion: v1's net expectancy over this stretch, the biggest source of uncertainty, and whether to build v2 or move to forward testing.
How to write it up: Report the numbers first: v1's net expectancy over 20 nodes is X, and Y over the 8 holdout nodes. Then the risk: only 20 samples, and costs may be underestimated. Then the next step: forward test, no v2 yet. Never write it up as proven.
Scoring (15 points):
- 3 points: rules frozen before starting, with a timestamp.
- 3 points: 20 continuous nodes, with traceable exclusions.
- 3 points: every call made before the outcome, with nothing filled in later.
- 2 points: costs and unfilled orders both recorded.
- 2 points: development and holdout kept separate, holdout viewed once.
- 2 points: a new version number for every rule change.
Back-filling an entry, deleting a losing sample or peeking at the holdout repeatedly fails the exercise.
Take the win rate and average win and loss from your conclusion and plug them into the Expectancy Calculator, first without costs and then with them. Then run the net figures through the Monte Carlo Simulator to see how far random variation can swing a sample as small as 20 nodes.
Tools you can use
- Expectancy Calculator: compare gross and net expectancy to see how much edge costs eat.
- Monte Carlo Simulator: run thousands of paths from your backtested win rate and reward-to-risk to see how shaky a small-sample result is.
How this connects
- Upstream: Lesson 3 taught you to compute expectancy from a sample, and Lesson 5 taught you to write setup definitions and exclusions. This lesson puts both inside a no-peeking process. Lesson 22's review uses the same discipline: cover the outcome and look only at what was visible then.
- Downstream: Lesson 26's forward test picks up rules that passed the holdout here and keeps testing on markets that haven't happened yet. Lesson 27 on strategy drift deals with rules that wear thin over time.
Practice this lesson in NQ Replay
Replay can't be rewound and the Unplayed picker helps you pick days you haven't played, which closes two common ways of peeking at the future. NQ Replay is our own app for practicing on past NQ futures sessions, replayed tick by tick in simulation, with bracket orders, prop-style loss limits and per-trade review. You can request a free 7-day trial; you'll need your own licensed NQ tick data.
Previous and next
For educational purposes only. This is not financial advice and makes no promise of returns. Tickers, dates and market moves in real trade examples come from public sources. Individual P&L and record figures have been adjusted. Illustrative figures are the author's own. Trading involves risk of loss.
Test it in the calculator
How much edge is left after costs?
Once round-trip costs go in, what happens to your expectancy and breakeven win rate?
Example (our own numbers): 70% winners at +$9, losers at -$15, gross expectancy +$1.80. With $0.80 per trade in costs it drops to +$1.00, and breakeven rises from 62.5% to about 65.8%.
Open the Expectancy Calculator