
In one line: keep two separate scores. Grade the opportunity before entry and let it set size; grade yourself at the close on one process goal only. After a few months, check whether A trades really beat B trades. Only then do grades earn the right to move your size.
Lesson 24 of the 30-part Trading Decisions course. By Eliza.
Lesson map
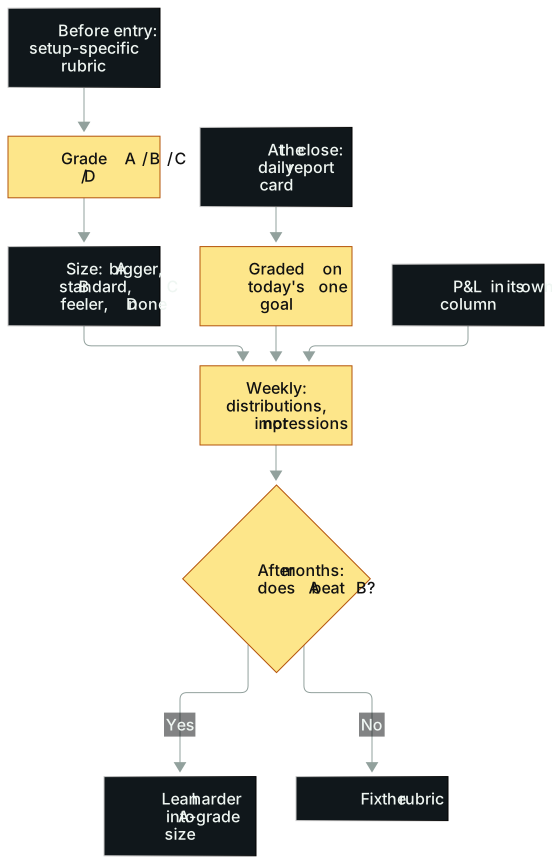
In words: (1) Before entry, grade the opportunity A, B, C or D with a rubric built for that specific setup. (2) The grade maps to size: A bigger, B standard, C a small feeler, D no trade. (3) At the close, fill in a daily report card graded only on whether you made progress on today's one process goal. (4) P&L sits in its own column and never enters the grade. (5) Each week, look at the distribution of grades and scores instead of your impressions. (6) After a few months, check the record. If A trades really beat B trades, lean harder into A-grade size. If not, fix the rubric.
Opening: a $9 loss that earned an A
The misclicked hotkey from the last lesson came from a show where a veteran trader read community trade reviews out loud. That one got an A-minus. The next review on the pile had a day's result of minus $9.
The trader was shorting a first red day: a stock that had run two days straight and might print its first red candle on day three. The name was LiveWire (LVWR), Harley-Davidson's electric motorcycle spin-off. The review contained:
- A provisional grade of B, written before the open, with a note: drop to C on a big gap down.
- A list of pros and cons. Pros: moderate dilution risk, the key pivot level had been respected, two days up, widening daily ranges, plenty of order flow, no squeeze risk. Cons: falling volume, and the company had posted a good quarter.
- A look through 35 similar cases in his own notes app.
- An entry on a failed breakout attempt, then adds. A sharp reversal reclaimed the level, he got out, and the trade closed down $9.
Around 1 p.m. the next day he added a note. In his case file, most first red days don't chop sideways for three or four hours before breaking; this one only broke around 1 p.m., which made it unusual. He also noted that he should have stayed open to the trade still working.
His coach later graded the trade a B as well. In the chat, the trader added that he didn't want to fall into the habit of copying his coach.
The veteran gave the review an A. Most people never write a review this thorough in their lives, he pointed out, especially at this stage.
The trader before him made a few hundred dollars and got an A-minus. This one lost $9 and got an A. The grade looked at a whole page: a plan before the open, pros and cons, recognizing the failed breakout, a follow-up note, using his own case data to judge whether the day was unusual, and trading his own read instead of copying. The P&L was one number.
This lesson is about building a page like that, so "how much did I make" steps aside.
The idea
One score for the trade, one for you
The two scores answer different questions. Don't blend them.
The opportunity grade asks: how good is this trade? You set it before entry, and it decides size. Most traders treat every trade as the same quality and bet the same amount. Lesson 15's poker analogy applies: starting hands differ, and so do chart setups. No setup wins every time, but some carry far higher expectancy and deserve different treatment. Break down a top trader's P&L and most of the profit usually comes from a small number of A trades.
The daily report card asks: how did I do today? You fill it in at the close, and it judges process only. Long-run results come from stacking good decisions one at a time, not from chasing a single outcome.
The two classic mistakes run in opposite directions: celebrating a green day despite sloppy discipline, and beating yourself up over a red day despite flawless execution. Whether a day closes red or green often says less about your execution than about where the market happened to go.
On a hard day full of traps where most people lose, making $200 might be excellent work. On the best day of the year, when others make ten thousand, the same $200 might be mediocre. Red and green can't see that difference. A report card can.
Put together, the two scores are the two ledgers from Lesson 1: the grade belongs to decision quality, the report card records execution quality, and P&L lives in its own column.
Scores are set in the moment
The grade goes in before entry. Once you've seen the outcome, hindsight bias leaks into every score. The day's goal goes on the report card in the morning. A score written after the fact is an explanation, not a score.
Method 1: grading opportunities A to D
Four grades
| Grade | Definition | Size |
|---|---|---|
| D | No trade, the hand you fold. The vast majority of charts on your screen sit here or lower | Zero |
| C | A real setup, but most of the favorable conditions aren't present together. A feeler trade with roughly breakeven expectancy | A fraction of normal |
| B | The bread and butter. Meets the criteria, nothing special, no obvious flaws, positive expectancy. Hundreds a year. Boring trades pay the rent | Standard |
| A | Everything lines up: chart, catalyst, market and tape all point the same way. One of the best trades of the day, maybe of the month | Larger |
Add pluses and minuses if you like; opportunities differ in fine ways. The grading is subjective. Your A is not someone else's A. The point isn't to copy anybody's standard. The point is to have one, so you're forced to ask, before every trade, how good it really is. Asking that question alone separates you from traders who click on feel.
A reference for frequency and size
One common calibration: A trades show up once or twice a month and you still remember them at year end. B trades might come dozens of times a month, among the best of a given day. C trades are ordinary daily trades with a slight edge, not worth a dedicated review. D trades are mediocre coin flips you got sucked into out of boredom, likely negative after costs.
Size can scale hard. Here's our own illustration: a trade that grades as a B in real time gets a planned risk of $6,000. If you realize mid-trade this may be the best opportunity of the month and liquidity allows, you take it up to $60,000 of risk, ten times. Note that this is planned risk, not position value.
That kind of scaling isn't for beginners. It assumes a base playbook you can execute consistently, the ability to tell an A+ from a B, and the discipline to change size without changing your system or your psychology on entries and exits.
Beginners should use uniform size, such as a fixed $50 of risk per trade or 0.5% of the account. Understanding and judging the setup already uses up your mental bandwidth. Keep a card on the desk listing the risk for A, B, C and D, with "no trade" in the D box. When you want to size up, you change the card, and you look at it every day.
One rubric per setup
Using one rubric for every setup is like grading a math exam with the rubric for a history essay. Here are two simplified versions.
Capitulation reversal (everyone sells at once and you step in for the bounce):
| Variable | What scores high |
|---|---|
| Speed of the drop | Candles that make your stomach turn when you glance at the account. Drifting down 3% in a day is just a down day |
| How boring the stock usually is | A sleepy, low-beta name suddenly down 15%. A volatile name drops 15% every other week; it means nothing |
| Daily chart location | Falling into multi-year support. Buying after six months of decline is catching a knife |
| Intraday chart | Outweighs every other factor. If the intraday chart is poor, everything else must be near perfect, and even then you may pass |
| News | None, or only old news. A 20% drop on a terrible quarter and slashed guidance is just the news being repriced |
A high-scoring example: a boring utility, no news, down 11% in a little over two hours into long-term support, with a strong selling climax on the tape. That could be an A.
Breakout:
| Variable | What scores high |
|---|---|
| Consolidation | Long, tight, clean bases score high. Five days of messy sideways action offers little |
| Volume | The breakout's fuel, and proof others are watching the level |
| In focus | An active name in a hot sector, ideally with a major new catalyst |
| Market conditions | Breakouts usually need a cooperating market. When the indexes are being sold, most breakouts are traps |
| Daily chart | Several timeframes aligned, with swing traders, day traders and institutions on your side |
The market variable alone can knock an A down to a C or worse. The same variable barely matters in the reversal rubric and holds a veto in the breakout rubric. That's why the two can't share a page.
Three steps to put it in place
- Write the criteria down. For every setup in your playbook, list the 4 to 6 variables that matter most. If you can't, the setup isn't defined yet, and you're trading on feel.
- Grade before entry. Put the grade in the journal so scoring happens before the outcome.
- Audit after a few months. Compare grades with results. Do A trades really beat B trades? If yes, lean harder into A-grade size. If not, the rubric is off, and now you know which variable to fix. Grades are what turn a journal from a diary into data you can compute. Without step 3, A to D is just a nice label.
Method 2: the daily report card
One page
Date ______  Grade (A to F, on the goal only, never on P&L) ______
Readiness: focused? slept well? feeling well? ready to engage?
  → sets how much risk I'm willing to take today
Today's single goal: ______
Reminders to myself (read before the open): ______

9:30–11:00 ______
11:00–12:00 ______
12:00–14:00 ______
14:00–16:00 ______
  Each block: does the morning readiness grade still hold? Did I stick to core setups?
  Was size sensible? Was my attention on the trades that were working?

What I learned or improved today
Changes I need to make based on today (each with a fix)
Misc: what distracted me, what trends I noticed
The easiest money available today: which trade was it?
Tickers traded, review of key trades (optional on quiet days)- Morning readiness. Around 9 a.m., check in: how did you sleep, are you tired or distracted, sick or hungover, emotionally off balance, is anything outside trading weighing on you? Give it an F-to-A grade that directly sets the day's risk (Lesson 20). C or worse, size way down or sit out. An A plus a market full of opportunity means you can press. Size shouldn't be the same every day; it should follow the opportunity and your capacity to execute.
- Four time blocks. They catch a bad habit before it snowballs. Blow one block and the later ones can still be good, and the day can still pass. Pick the day's one goal before the open, glance at the card during the session, and finish the review section within half an hour of the close.
- The easiest money. Which trade today could you have taken cleanly, straight out of your playbook? Size doesn't matter. People get pulled toward wherever the biggest dollars were, which is often a mistake. The overlooked layups usually pay far better for the effort.
One goal at a time
The grade ignores red or green, a big win or a flat day. It asks one thing: did I make progress on the goal today?
- Goals aren't about P&L. Examples: did I overtrade, was size planned, am I under-participating in a setup, did I miss key clues on the tape.
- Find the problem, then break it down with a fix. If the problem is overtrading, the goal is "five trades a day, maximum." Others: "no trades outside the playbook," "no fighting the trend."
- One at a time. A goal runs about three to four weeks. Chase three at once and four or five months later none of them may be where it could have been. Some goals run three or four months, and that's fine.
- When to switch. When it's no longer the highest-return goal for your effort. One extra trade now and then doesn't mean you can't move on. Chasing perfection slows progress.
- Fill it in on quiet days. Those days matter most, because most people let them slip by. A day with no setups still teaches something.
- Every problem needs a fix. Writing "I overtraded" without a fix is half the job (Lesson 23).
- Don't leave until it's done. The laptop stays open until the card is complete.
Where goals come from: the biggest bottleneck
Performance is limited by four things: edge, execution, opportunity and risk. Better tools and longer hours won't move P&L unless they loosen whatever is actually binding you right now.
You can do the math on bottlenecks with three inputs: potential payoff, effort required and odds of success. With our own numbers: project one might add $8,000 and take 80 hours; project two might add $15,000 and take 300 hours. Project one pays $100 an hour, project two $50. Do project one first. That doesn't mean project two is worthless; all else equal, start with the best return per hour. Top performers don't try to fix ten things at once. They solve one meaningful problem at a time.
Method 3: weekly and yearly, distributions over impressions
The weekly review
Five items:
- This week's distribution of A to D grades and the results by grade. Is A still beating B?
- The distribution of daily grades. Which time block keeps scoring lowest?
- How many trades carry the "profitable rule break" tag (Lesson 23).
- Did the current goal make progress this week? Is it time to switch?
- Next week's single goal, with a concrete daily action.
The annual review
The same thinking, scaled up to a year, in four steps:
- Clean and tag. At minimum: ticker, date, gross and net P&L, borrow fees, plus custom tags. The cuts are nearly endless: swing vs. intraday, breakout vs. reversal, IPOs, small vs. large caps, stocks, options, futures or crypto, bad-sleep days, time of day, day of week.
- Look for patterns. Which strategies did you trade most, which made the most, which lost the most, and what surprised you? Data often disagrees with gut feel.
- Best 20, worst 20. Screenshot daily and intraday charts. For each, note setup type, market context, daily and intraday read, catalyst, entry, exit and target, whether size fit, emotional state and the key lesson. Then compare what the best trades share and what the worst ones share.
- Review missed trades. The ones you didn't see, and the ones you saw and skipped.
This is a multi-day project at a few hours a day. And it has to turn into real changes in how you trade: put fixed checkpoints on the calendar every few weeks or monthly, and review goals with a trading group if you can. A goal that never becomes an action might as well not exist.
More real cases
Mondays were the worst, until he checked
A veteran trader said that before his annual review he'd have sworn Mondays were his worst day. The numbers showed Monday was his best. He was so surprised he checked the data a second time. It held.
His best guess: losing money at the start of the week feels sharper and sticks in memory. Memory can lie; the numbers don't.
Another trader found a surprise of his own. On the last trading day before a vacation or holiday, his odds of a large loss, and of a losing day overall, were clearly higher. His head was already out of the office and his guard was down. You won't recall a pattern like that. Only tagged statistics show it.
"IPOs make me money." Split it first
The new trader from Lesson 3 traded IPOs because they made money. In total, that was true: the category was up $11,000. Split it, and three hot IPOs made $30,000 while seven weak ones gave back $19,000.
In Lesson 3 that was an expectancy example. Here it's a tagging example. Without a "hot or not" tag in the journal, no weekly review would ever show the difference, and the only conclusion available would be "I'm a positive-expectancy IPO trader."
You can also paste the scorecard and stats into an AI tool every day and ask what patterns you're missing, say (hypothetically) Fridays that always give back gains or worse trading after two green days in a row. The real answers are still in your own data.
Writing lessons from a few dollars up
A trader with an engineering background wrote four things on his scorecard every day: today's lesson, what I'll improve, exactly how, and doing it tomorrow. In the early days, the P&L lines on those cards were small wins of a few dozen dollars and single-digit losses. A few years later the same lines held five- and six-figure days.
Looking back, the people who worked with him could already see in those tiny early reviews what the trades would grow into. Others posted P&L; he posted lessons and fixes. While he was still making a few thousand a month, partners were already calling him someone to watch. He went on to have seven-figure years.
There's an old desk saying: don't get up from your seat until you've found the fix for a bad session.
Weekends at the office, quarter size on Monday
One trader spent hours at the office on weekends, reading research and prepping catalyst notes. Normally that kind of effort earns praise.
Then look at what he did live: the best setup of the week appeared, and he traded a quarter of the size it deserved. Real money made him uncomfortable. The problem wasn't research. It was his relationship with risk. Hand him AI tools that summarize twenty reports in the time he used to read three, plus assistants that watch filings and summarize earnings calls, and he'd read more than ever. When the bell rang he'd still trade quarter size.
Being busy says almost nothing about whether you're improving. The goal line on his report card should have said size. Writing "read more research" sent it off course again.
Common mistakes
1. Grading the report card on P&L. A for green and C for red is just a P&L sheet with a new cover. Fix: grade only the day's one goal.
2. Running several goals at once. Three in parallel and four or five months later none may be done. Fix: one at a time, three to four weeks.
3. Grading after the fact. A grade set later always agrees with what happened next, because you've seen it. Fix: grade before entry, in the journal.
4. Copying someone else's standards and numbers. Your A isn't anyone else's A, and their risk amounts aren't yours. Risk management has no universal answer, the same way nobody can tell you what to eat without knowing your health goals, budget, tastes and allergies. Fix: define it from your own strategy and history, then audit after a few months.
5. One rubric for all setups. A-grade conditions for a capitulation reversal are nearly the opposite of those for a breakout. Fix: one rubric per setup, 4 to 6 variables each.
6. Goals like "stay calm." Too vague. What sets you off, how do you avoid it, and what does calm actually mean (Lesson 19)? Fix: write something countable, such as "five trades a day, maximum."
7. Skipping quiet days. Those are the days that matter most. Fix: no trades still means writing down what you learned.
Where this applies
Opportunity grading assumes a playbook and a sample you can record. Without them, go back to Lessons 4 and 5, define setups and build the sample first. Grades only get to move size after months of audit show A really beats B. Until then, trade uniform size.
The report card doesn't have to be copied as-is. If you take one or two trades a day or have no fixed session, slice the time blocks in a way that fits you. A format you'll actually keep using is the one that has value.
An experienced trader's hours, product range and risk scale don't transfer to a beginner. Treat annual goals as scenarios, not orders to size up.
For FX and CFD traders, cut the time blocks by session rather than U.S. stock hours: Asia, London and New York each get a block, plus a separate block around major data releases. Add a "spread and liquidity" variable to every rubric. The same setup during the thinnest hours should automatically drop a grade.
Practice: build your rubric and replay five days
Exercise 1: grade three scenarios
Use the capitulation rubric above.
- Scenario A: a high-volatility momentum stock, down 15% this Tuesday, no news.
- Scenario B: a low-beta stock, down 11% in a little over two hours, no news, into long-term support, with a strong selling climax on the tape and a healthy intraday chart.
- Scenario C: a stock down 20% on a terrible quarter and sharply lowered guidance.
Reference answers: A is D to C; names like that drop 15% routinely, so it's just another Tuesday. B is an A, worth larger size. C is a D; that's not capitulation, it's news being repriced.
Then answer one more: with the breakout rubric instead, how would "market conditions" change the grades in the same three scenarios?
Exercise 2: your own rubric and a five-day replay
- Pick one setup from your playbook. Write 4 to 6 variables, each with what high and low scores look like, and the size for A, B, C and D (uniform size is fine for beginners, but D must say no trade).
- Using the report card format above, design your own page. It must include a goal line, time blocks and a fix column.
- Replay your last five trading days with it, filling in only the grade, goal progress and fixes.
- Write a one-page weekly review: grade distribution, the lowest-scoring time block, one recurring pattern, next week's single goal, the daily action, and the test for switching goals in two weeks.
Scoring (16 points):
- 3 points: 4 to 6 variables, each with observable high and low descriptions.
- 2 points: grade set before entry, clear size mapping, D marked no trade.
- 3 points: grades based on the goal only, with no P&L anywhere on the card.
- 2 points: complete evidence for all five days.
- 2 points: the weekly review uses distributions, not impressions.
- 2 points: one goal for next week, with a daily action and a switch test.
- 2 points: every entry in the fix column has an actual fix.
Worked example: a day up 3R where the goal was "no trades outside the playbook" and one such trade was taken gets "goal missed." A day down 1R with the goal met and size compliant can grade high. Any card that uses "because I made money today" as a reason gets redone.
After a few months, load your graded trades into the Trade Journal Analyzer and split them into A, B and C. Then run each group's win rate and average reward-to-risk through the Expectancy Calculator to see whether A grades really deserve more size.
Tools you can use
- Trade Journal Analyzer: split P&L by grade, weekday and time of day, so distributions replace impressions.
- Expectancy Calculator: compare expectancy per trade across grades to test whether your rubric works.
How this connects
- Upstream: Lesson 1's two ledgers are where both scores start. Lesson 23's "profitable rule break" tag and fix column feed the report card. Lesson 5's setup definitions come before any grading.
- Downstream: Lesson 29's 60-day plan puts "one goal, three to four weeks" on the calendar. Lesson 30's continue, pause or quit decision uses these weekly distributions and trends.
- Related: Lesson 13 works size back from per-trade risk, which is where the A to D size tiers finally land.
Practice this lesson in NQ Replay
Multi-day statistics and CSV export give you the raw numbers for the weekly scorecard. NQ Replay is our own app for practicing on past NQ futures sessions, replayed tick by tick in simulation, with bracket orders, prop-style loss limits and per-trade review. You can request a free 7-day trial; you'll need your own licensed NQ tick data.
Previous and next
For educational purposes only. This is not financial advice and makes no promise of returns. Tickers, dates and market moves in real trade examples come from public sources. Individual P&L and record figures have been adjusted. Illustrative figures are the author's own. Trading involves risk of loss.
Test it in the calculator
Is your A grade really better than B?
Once you split trades by grade, how far apart is the expectancy per trade?
Example: 12 A trades at a 58% win rate and 2.4 reward-to-risk come to about +0.97R each. 60 B trades at 48% and 1.6 come to about +0.25R. A gap like that earns A-grade size.
Open the Expectancy Calculator