
In one line: a forward test checks whether you can recognize and execute a setup without knowing how it ends. Freeze the rules, keep a signal ledger and an execution ledger, and size the sample to the question. Report a range, and if the range includes zero, keep collecting.
Lesson 26 of the 30-part Trading Decisions course. By Eliza.
Lesson map
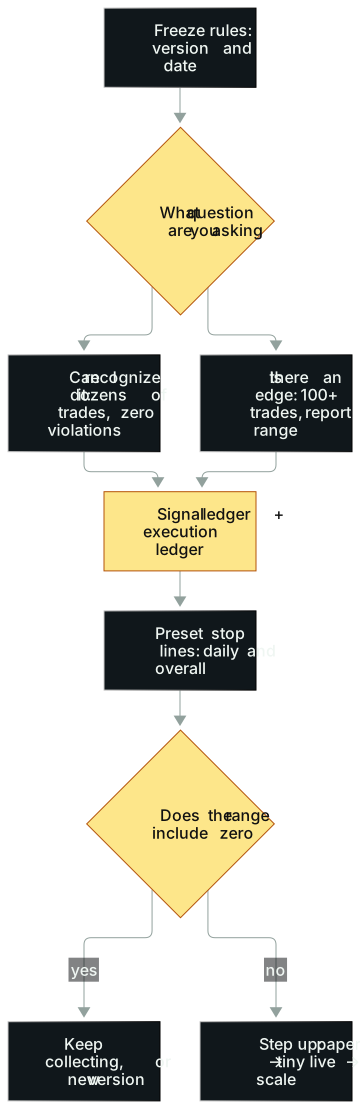
In words: (1) Freeze the rules and write down a version number and date. (2) Decide what this test is meant to answer. "Can I recognize it?" needs a few dozen trades with zero violations. "Is there an edge?" needs at least 100 trades and a reported range. (3) Every qualifying signal goes in the signal ledger; every actual action goes in the execution ledger. (4) Write daily and overall stop lines before you start. (5) At the target count, look at the range. If it includes zero, keep collecting or start a new version. If it does not, step up one level using thresholds you wrote in advance: paper, then tiny live size, then scaling.
Opening: twelve attempts, half the pass rate
The founder of a futures evaluation firm once shared two numbers in public (adjusted here).
On a single attempt, about 15% of people pass. But if someone gives themselves a year and takes one evaluation a month, twelve in all, about 45% eventually pass.
The second number sounds encouraging. Plug in the first one, though, and something is off.
If each attempt were an independent draw at a constant 15%, the chance of failing all twelve is 0.85 to the twelfth power, about 14.2%. The chance of passing at least once is then about 85.8%, roughly 86%. That formula does not produce the adjusted 45%. The 45% is the other adjusted illustration, not a measured pass rate for any firm. The gap does not by itself show that people failed to improve: unequal skill, different attempt counts, dropouts, rule changes and correlation all break the independent-draw model.
The attempts are not fresh draws. People who fix one thing after each failure get closer every month. People who fix nothing repeat the same mistake twelve times. For them, attempt twelve is the same as attempt one, and the odds never stack.
That evaluation is a forward test with a business model: frozen rules, capped size, out when you hit the line. It also shows the point most forward tests miss. Running the same unchanged rules twelve times tests your patience. Changing one thing, giving it a new version number and running it again tests the rules.
This lesson is about designing that exam for yourself, and knowing how many questions it takes before the score means anything.
The idea
A forward test answers what a backtest cannot
A backtest looks back at a finished chart. You can always spot the pattern in history because what came next is sitting right beside it. A forward test is different. The rules are frozen, the future arrives one bar at a time, and you have to decide whether this is a signal, get in when you should and get out when you should, without knowing the ending.
Where do win rate, average win and average loss come from? With historical data, you backtest past examples. Without it, you forward test: on paper or at tiny size, you look for setups that meet your preset conditions and record as you go. Both share one floor: you do not pick samples to get the answer you want. Everything that qualifies goes in.
A dozen charts is a ticket, not proof
The order for building a library is: classify the pattern, screenshot it, file it. Once you have a dozen or more charts, ideally far more, you start asking which variables make it better or worse, and where the entry, stop and target belong. After the rules are written, you backtest or forward test. Only a pattern that has been tested and shows positive expectancy deserves real risk.
A dozen charts gets you in the door to start studying. It does not prove an edge. The gap between the two is this lesson.
Two ledgers: signals and execution
- Signal ledger: every setup that meets the conditions, including the ones you skipped, missed or hesitated on. Record what would have happened if you had followed the rules.
- Execution ledger: what you actually did, at what price, at what cost, and whether you broke a rule.
Logging only your fills is like quietly deleting the hardest signals every night and then estimating your edge from what is left. The signal ledger tells you about the rules. The execution ledger tells you about you. The wider the gap between them, the more the problem is execution, not the rules.
Here is an example with our own numbers. Over 30 days, 40 signals appear and you take 26. In the signal ledger, all 40 played by the rules average +0.4R. In the execution ledger, your 26 trades average +0.1R. Several of the 14 you skipped were the hardest to take and ran the furthest. Rewriting the rules here fixes the wrong thing. The thing to fix is execution.
Minimum sample depends on the question
There is no universal number. Different questions need different counts.
| Question | Rough scale | Use |
|---|---|---|
| Can I recognize this setup and run the process by the rules | A few dozen trades in a month, zero risk-rule violations | Pass this before talking about profit |
| Is this pattern worth studying | A dozen charts or more, the more the better | Build the library, find variables |
| Is this actually a strategy | 100+ trades should show positive expectancy; if not, what you have is hope, not a strategy | The floor |
100 trades is a floor, not a license. Take the made-up rules from Lesson 25: win $9 70% of the time, lose $15 30% of the time, for an expectancy of +$1.80 a trade. That is a decent edge. How many trades does it take for a sample to reveal it?
The standard deviation of a single trade here is about $11. The margin of error on the sample average is roughly that number divided by the square root of the trade count, times 1.96 for a 95% range:
- 20 trades: about ±$4.80, so the average could land anywhere from −$3.00 to +$6.60. That includes zero.
- 100 trades: about ±$2.20, a range of −$0.40 to +$4.00. Still includes zero.
- About 144 trades: exactly ±$1.80, so the lower end just touches zero.
- 300 trades: about ±$1.20, a range of +$0.60 to +$3.00.
Cut the edge in half, to +$0.90 a trade, and the count does not double. It roughly quadruples, to nearly 600 trades. Real strategies after commissions and slippage usually have a thinner edge than they do on paper. So 100 trades only supports "nothing says it fails yet." It does not support "it works."
The evidence ladder: paper, tiny live, scale
Risking real money before you have shown an edge is one of the most expensive mistakes in trading. The order has three steps:
- Start on paper. Risk nothing and record every trade.
- When paper shows a real edge, go live with as little money as possible to confirm the strategy survives real fills.
- When tiny live size makes money, scale up in steps.
Paper has a catch: fills are often too generous, and commissions and fees may not be deducted. Even so, it is cheaper than paying tuition with real money.
Each rung tests something different. Paper tests recognition and process. Nobody hesitates to click in a sim; a ten-million-dollar paper account carries no risk at all. So paper cannot test your hands when real money is on the line. Tiny live size does that. Buying one share and risking one dollar is something nobody freezes on. Most people spend less time on paper and minimum size than they should. Everyone wants to go fast.
The method: a forward-test protocol you can run
- Freeze the rules. Write a version number and date: setup conditions, entry, stop, target, and when you stand aside. During the test you record, you do not edit.
- Pick the question, then the count. For "can I recognize it," aim for a few dozen trades and zero violations. For "is there an edge," aim for 100+ trades and report a range at the end, not just an average.
- Two ledgers. Miss nothing in the signal ledger. Record price, cost and violations in the execution ledger.
- Preset stop lines. A maximum daily loss that ends the day when hit. A number of violations or a cost level that pauses the whole test. Write them before you start, not while you are losing. Check what losing streak is normal with the losing streak calculator first, and put the stop line outside normal variation.
- Step-up thresholds. Paper to tiny live: enough trades, no violations, and the lower end of the after-cost expectancy range still above zero. Tiny live to scaling: real fills do not diverge meaningfully from paper. Write each threshold in advance.
- Changing a rule means a new version. If a condition turns out to be bad midway, you may change it, but the change starts a new version and the count resets. Old samples can only suggest hypotheses.
- Finish with a one-page report. Signal coverage, execution rate, violation count, after-cost expectancy and its range, and the next step: continue, step back, scale, or stop.
The starting unit for live trading can be 100 shares for stocks or one micro contract for futures. Your minimum unit should be small enough that 20 losses in a row would not cost you sleep.
More real cases
A hundred shares for ten months
The trader from Lesson 13 who shorted parabolic stocks knew from day one that he would be bad for a while, so he traded the minimum size during the learning phase. His reasoning was that you earn the right to size up with data. His account turned positive after about ten months, then went years without a losing month, and his size stayed modest. Of the dozen or so people who started with him, most were gone within a year or two.
He had a counterintuitive observation about new traders: many win big in their first month, and it hurts them. They decide trading is easy, push size hard, suddenly dig a hole they cannot climb out of, and keep forcing it. Read as a forward test, that means the three winners at the start of a test are the most dangerous data you have.
Hope is the expensive habit
A veteran trader recalled that when he first learned to trade in college, he thought every indicator was a magic bullet. But whenever he built a rule-based system around one and tested it, it almost never held up. He found that out one system at a time, by testing, not by thinking.
His remedy was two things: keep a journal and track everything, and grade yourself on a scorecard every day. There is also a line that gets passed around the industry: hoping is the most expensive drug there is. A forward test turns "I think it works" into "here are its numbers over N trades."
A small library makes anomalies visible
In Lesson 24, the trader who lost $9 and still gave himself an A checked 35 similar cases in his library. Most first-red-day setups did not drift sideways for three or four hours before breaking down. His trade broke at 1 p.m., which made it an outlier in his own data.
That is the second job of a sample: it gives you a baseline, so anything that departs from it shows up. Without those 35 cases, a 1 p.m. breakdown is just something that happened. With them, it is an anomaly you can measure.
Someone else's track record is a backtest without a forward record
The checklist for vetting a paid trading service is basically someone else's forward test:
- Audited statements, tax documents, verification platforms connected directly to a brokerage, and recorded live trading.
- Whether they trade the signals they teach with real money.
- Whether the people they taught have verified P&L.
- Whether they show losses and drawdowns. If they do, that is a good sign. Be very careful with anyone who never struggles and never loses. Either the charts were edited or what you see was heavily cherry-picked.
- Most important: after two to six months, whether you yourself see real, specific improvement you can feel. Not necessarily profit.
That last item turns the forward test back on you. Whether something you paid for works is a question for your own record, not their equity curve. Many journaling tools let you import trades from a spreadsheet; a dashboard screenshot proves nothing. Most trading information on the market has no edge, and your own forward record is the one piece of evidence nobody can retouch.
Common mistakes
1. Scaling up after three winners. By the math above, even a 20-trade range can cross zero. Fix: write the conditions for scaling up as a trade count and a violation count before you start, not as "it feels about right."
2. Logging only fills. Leaving out skipped signals is picking your sample. Fix: keep the signal ledger and the execution ledger separate. Where they disagree is where to dig.
3. Treating paper fills as real. Paper fills tend to be generous and may skip fees. Fix: deduct a conservative cost by hand on paper, and switch to real costs at tiny live size.
4. Changing rules midway and mixing samples. Once the rules change, the old sample measures the old rules. Fix: new version, count resets, keep the old sample for hypotheses.
5. Treating 100 trades as a license. 100 is the floor, and it needs a range. Fix: end the report with one line stating the expectancy range. If it includes zero, keep collecting.
6. Retaking the exam unchanged after a failure. The opening math shows that repetition without change does not stack the odds. Fix: after each failure, write down the one thing you changed and test it under a new version number.
Where this applies
- Low-frequency strategies cannot wait. At one signal a week, 100 trades takes two years. Validate them with historical data plus tiny live size, but treat the conclusion as weaker, and do not use it to raise risk on other strategies.
- Event-driven setups, such as reversals after a major panic, happen a few times a year. The sample will never get big, so lean on a large set of historical cases plus very small live size.
- When market structure changes, old samples stop applying. That is the next lesson.
- The sample sizes here are for estimating expectancy. If you only want to check whether you can recognize the signal, a few dozen trades will expose the problems.
FX and CFDs offer one convenience and one trap. The convenience: many platforms have demo accounts, and some brokers allow very small lot sizes, so the step from paper to tiny live size is almost free. The trap: demo spreads and fills are often much better than live, especially around data releases, and some demo accounts do not charge overnight swap. So on paper, add the typical live spread to your cost column by hand, and at tiny live size, compare fills between the two accounts on purpose.
Practice: a 30-day two-ledger protocol
Materials: pick a setup you already have rules for. If you do not have one, use the made-up rules from Lesson 25: win $9 70% of the time, lose $15 30% of the time, expectancy +$1.80.
Part 1, the math. Using the method above, work out the 95% range for +$1.80 at 20, 100 and 300 trades. Then work out how many trades it takes to separate the edge from zero if the edge is cut in half.
Part 2, the protocol. One page: rule version and date, the question you are answering, the target count, daily and overall stop lines, step-up thresholds, and what happens after a failure (step back, new version).
Part 3, run it for 30 days. One line in the signal ledger per signal and one line in the execution ledger per action. Finish with a one-page report: signal coverage, execution rate, violations, after-cost expectancy and range, next step.
Scoring (out of 10):
- 2 points: the protocol was written before the start, with a version and date.
- 2 points: the signal ledger includes the skipped signals.
- 2 points: stop lines and thresholds are numbers you can enforce.
- 2 points: the conclusion reports a range and matches the strength of the sample.
- 2 points: no rule changes midway, or any change started a new version.
Reference: a protocol that writes the step-up condition as three numbers (50 trades, 0 violations, lower end of the after-cost range above zero) and only moves to 100 live shares when all three are met earns full marks. A report that concludes it is time to size up after three winners gets 4 at most.
Before you start, use the losing streak calculator to estimate the normal longest losing streak over 100 trades at your win rate, and set your stop line beyond it. At the end, put each ledger's win rate and payoff into the expectancy calculator, then run a few thousand paths in the Monte Carlo simulator to see how widely the same edge spreads at 30, 100 and 300 trades.
Tools you can use
- Losing streak calculator: estimate the normal longest losing streak for a win rate and trade count, so your stop line sits outside normal variation.
- Expectancy calculator: compute expectancy for the signal ledger and the execution ledger separately to see whether the gap is in the rules or in execution.
- Monte Carlo simulator: see how far randomness can throw a small sample.
How this connects
- Upstream: Lesson 25 covers backtesting without peeking ahead; this lesson picks up with live validation once the rules are frozen. Lesson 4 turns a view into a testable hypothesis, which is the input here.
- Downstream: Lesson 27 covers spotting a strategy going bad once the sample exists. Lesson 13 covers scaling size with evidence. Lesson 29 schedules this protocol into a 60-day training plan. Lesson 30 uses these records to decide whether to continue, pause or quit.
- Same thread: Lesson 3 computes expectancy from a sample, Lesson 24 grades the process, and Lesson 18 covers the evaluation firm's "one lot, locked at the line" rules.
Practice this lesson in NQ Replay
Replay isn't a live forward test, but rules-first practice on unplayed sessions is a cheaper step to take before one. NQ Replay is our own app for practicing on past NQ futures sessions, replayed tick by tick in simulation, with bracket orders, prop-style loss limits and per-trade review. You can request a free 7-day trial; you'll need your own licensed NQ tick data.
Previous and next
For educational purposes only. This is not financial advice and makes no promise of returns. Tickers, dates and market moves in real trade examples come from public sources. Individual P&L and record figures have been adjusted. Illustrative figures are the author's own. Trading involves risk of loss.
Test it in the calculator
What losing streak is normal during a test
At your win rate, how long is the longest losing streak likely to be over 100 trades?
Example (our numbers): at a 45% win rate over 100 trades, the median longest losing streak is 6, the mean is about 7, and there is roughly a 30% chance of 8 or more. Set your stop line beyond that.
Open the losing streak calculator