
In one line: strategies rarely fail overnight. The warning signs come in order: setup quality, then win rate, and the equity curve last. Sort "it's been worse lately" into luck, execution, cost or market and treat each one differently. Write the brake as numbers, and write the release as numbers too.
Lesson 27 of the 30-part Trading Decisions course. By Eliza.
Lesson map
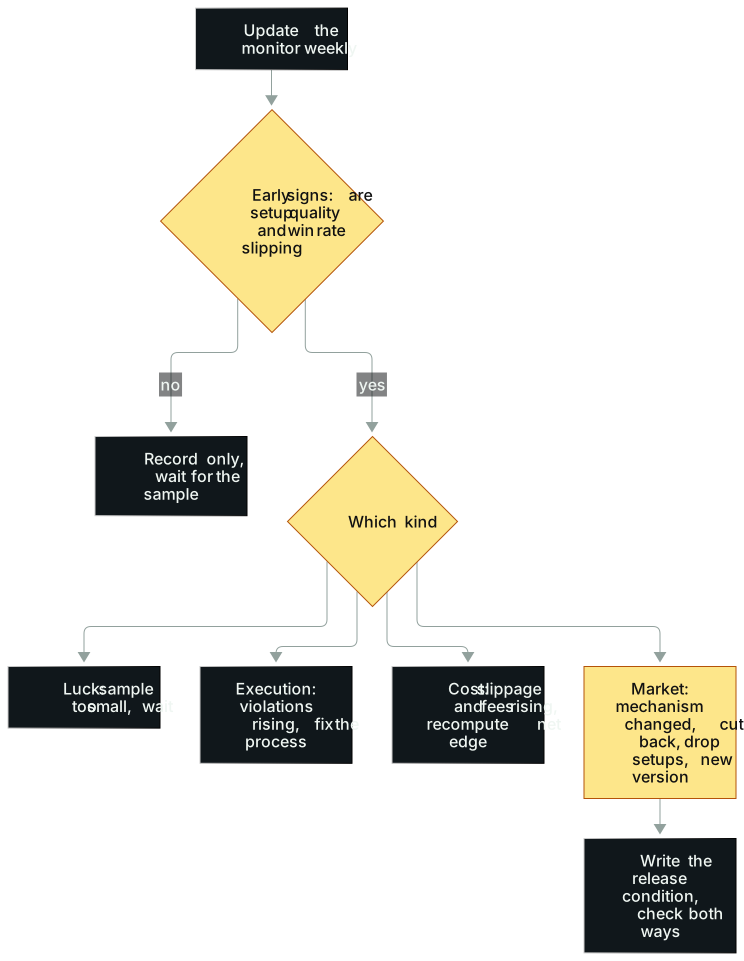
In words: (1) Update a one-page monitor every week. (2) Check the two early signs first: is setup quality falling, and is win rate falling? If not, just record and wait for the sample. (3) If they are, decide which kind of decline it is: luck (sample too small, keep waiting), execution (violations rising, fix the process first), cost (slippage and fees rising, recompute after-cost expectancy) or market (the mechanism that created the setups has changed; cut back, drop the weakened setups, start a new version). (4) When you hit the brake, write down when you will release it. The check runs both ways.
Opening: if you brake too early, you have to let go
A professional US equity day trader who trades momentum picked up a habit from slow markets.
Early on, when the market went quiet, he cut his risk per trade in steps: from a round number to 80% of it, then to 70%. Later he found that cutting size was not the best answer. Cutting trade count was. Forty trades a month became twelve. His reason was to save emotional capital. Before each open he asked himself one question: is there a real setup in front of me? When the market slowed, A-grade setups disappeared, and only a few Bs and a pile of Cs were left, he traded B and above only.
Near the end of summer 2025, he put his foot on the brake out of habit. He expected August and September to be choppier, with fewer good setups.
Two or three days into September, the market was as busy as the busiest stretch of the year, with ten or so decent setups every day. It was nothing like the September he had planned for.
He did not argue with his own forecast. He let off the brake right away. His test was concrete: were there ten or so setups in front of him each day? What he thought September ought to look like did not enter into it.
It is easy to read this as "he called it wrong." The more useful reading is that drift checks run both ways. Strategies can get worse, and conditions can get better. A monitor that can only brake and never release is as much a case of opinion beating data as an itch that can only press the gas.
This lesson is about building a two-way monitor: one that catches decline before it gets expensive, and lets go when the opportunities come back.
The idea
Conditions rarely drop from ten to zero
For most strategies, conditions do not drop from a ten to a zero overnight. The usual order has three steps. First, what used to work very well works a bit less well. Then win rate starts slipping. Finally, the setups that had already weakened stop working at all.
People who have managed a trading floor can see the whole room's data, and the pattern is clear to them. Newer traders often size up late in a good cycle and are the slowest to come off the gas when it is time to pull back. Mid-level traders do pull back, but too slowly. The best traders cut the moment they notice that a kind of trade is not working the way it did and their win rate is dropping.
So drift has warning signs. There are two: setup quality first, then win rate. The equity curve is the last thing to change. Watching only the equity curve is driving by the rearview mirror.
Four kinds of decline, four fixes
Break "it's been worse lately" into four causes:
- Luck. The strategy has not changed; the recent sample is too small. Fix: wait for more data.
- Execution drift. The rules have not changed; your actions have. Chasing, widening stops, skipping signals in the log. Fix: repair the process first.
- Cost change. Spreads, slippage or liquidity changed, and the same signal keeps half as much after costs. Fix: recompute after-cost expectancy and cut risk if needed.
- Market change. The participants, catalysts, volatility or flows that created the setups have changed. Fix: cut back, drop weakened setups, start a new version and retest.
The fixes conflict. If the truth is cause 1 and you apply fix 4, you have broken a good strategy. If the truth is cause 2 and you apply fix 4, you have turned your own rule-breaking into an act of God.
There is a clean test for cause 2. If you executed carefully and did everything you were supposed to, keep going. If this month you broke every rule in your playbook, and kept breaking them, the problem is you, not the market.
Cause 1 gets abused the most. If it really was a good hand that lost, you may not need to change anything. But traders reach far too easily for "just bad luck" or "the market is off." As Lesson 23 put it, one bad break is luck; bad breaks in a row are a trend to investigate.
How much a small sample can tell you
How do you separate bad luck from a trend? Sample size and a little arithmetic. Use the made-up rules from Lessons 25 and 26: win $9 70% of the time, lose $15 30% of the time, expectancy +$1.80 a trade, single-trade standard deviation about $11.
- Last 10 trades: the margin of error on the average is about ±$6.80. The average has to fall below about −$5.00 before it clearly departs from baseline.
- Last 30 trades: about ±$3.90. Below about −$2.10 counts as a clear departure.
Look at it another way. With the edge completely intact, about 16% of rolling 30-trade windows are still negative. Over 300 trades split into ten stretches, the chance that at least one stretch is negative is above 80%.
That is useful. A losing week, however ugly, most likely sits inside normal variation and is not enough to declare the edge dead. But if a full 30 trades land clearly below baseline, it is time to dig. Add the two early signs, falling setup quality and falling win rate, and the evidence moves from "maybe bad luck" to "worth acting on."
The lifetime average hides the recent past
The all-time average is a comforting number. The good early stretch props it up, and the recent bad stretch is diluted inside it. So a monitor needs three views at once:
- all-time;
- a rolling window of about the last 30 trades;
- groups by condition: volatility level, catalyst or no catalyst, time of day.
Set the groups in advance based on mechanism. Do not pick whichever split looks best after the fact.
Some changes are structural
Some drift will not wait for the cycle to turn, because the rules of the game have changed. A few that come up often in US equities over the past decade or so:
- News gets priced in much faster. By around 2014, news-reading algorithms were already trading major merger headlines.
- Panics recover faster. In the 2020 pandemic panic, US stocks took about two months to recover; the April 2025 tariff panic was largely recovered in about three weeks.
- Fat-finger trades and other inefficient order flow offer fewer chances, because algorithms and broker safeguards have improved.
- Index funds and ETFs dominate flows. Most stocks follow the index most of the time, so names with their own story matter more.
These are other people's observations about their own market and time. Do not treat them as your current facts. Check them against your recent records. But they are a reminder that some drift starts in the rules of the game, not in the cycle.
The method: one page, five moves
The monitor (update weekly)
| Item | How to check | Warning sign |
|---|---|---|
| Setup quality | Number of A, B and C setups this period | A setups nearly gone, B and C piling up |
| Win rate | Last 30 trades vs all-time | Falling for several periods |
| Execution | Violations, times a stop was moved | Violations rising |
| Cost | Actual slippage and fees as a share of gross profit | Clearly above the testing period |
| Peers | Whether traders who do the same thing are losing too | Everyone losing points to conditions |
The last row is the hardest, because it means admitting you might be wrong. Do a cold check: are other traders losing here too? Do they agree with your read? Get outside opinions. The easiest person for you to fool is you.
Five moves
- Cut trade count before you cut size. Like the trader in the opening, go from forty trades a month to twelve and take B and above only. This assumes you have been grading setups all along (Lesson 24).
- Drop the weakened setups. Go through them one by one, stop whatever has thinned out, and build a separate system for the conditions now taking shape.
- Go where the new focus is. In 2022, the monthly CPI release was where an edge showed up again and again, what some called a "broken slot machine." Many people's first reaction was that they had never traded CPI and it wasn't their thing. But nobody had traded CPI like that before, because it hadn't been an event that moved the whole market. The playbook was written on the spot.
- Keep a varied playbook. "I'm a momentum trader," "I trade small caps": identity is a dangerous switch. If the market changes and you don't, there is trouble. The drawdown playbook from Lesson 17 is built for this moment.
- A rule change means a new version. If you change a trigger, exit or condition filter, that is a new version. Old data suggests hypotheses; the new version starts building forward from zero (Lesson 26). Before changing anything, write down why, which metric should improve, what counts as failure, and when you will review it.
Brake and release, both as numbers
The lesson from the opening, on paper, is two lines:
- Brake: for example, fewer than 2 A setups a week for two weeks in a row, or the last 30 trades averaging below −$2 (converted to your own baseline).
- Release: for example, qualifying setups back to 8 or more a day for 3 days in a row, or the win rate on the last 15 trades back near the all-time level.
These thresholds are illustrations; the numbers should come from your own records. The point is to write both lines while you are calm.
More real cases
2000: the rules stayed the same, the market under them didn't
A trader recalled how he started in college. The Nasdaq was climbing from 2,000 to above 5,000. His method was simple: buy stocks that were already up 20%, 30%, even 40%, and sell into the gap up the next morning. During that stretch it worked the vast majority of the time.
In the first four months of 2000 he made a high six-figure sum. In the remaining eight months he gave back a five-figure one. Breakouts stopped following through, and the phone-room promoters who had been pumping small stocks were exposed; many of the stocks he bought had risen on their backs.
This is drift at its cleanest: not a word of the rules changed, only the market that made them work. He later admitted he had just followed the pattern without knowing why it worked. If you don't know why it works, you can't tell whether the condition is still there. That is the most useful idea in this lesson: you have to know why a strategy makes money to know when it has stopped.
Success can cause drift: capacity and cost
The first-red-day setup from Lesson 13 once ran at a win rate above 90%. Then everyone figured it out and it lost much of its punch. Lesson 25 used it to show how an edge thins. Here is a quieter version: scalping.
Scalping's biggest weakness is capacity. The bigger the size, the more the slippage and the thinner the edge. Many traders leave scalping as they get bigger, not because the setup broke but because their own size ate it. So the cost row in your monitor should be split by size tier. The same signal at 100 shares and at 2,000 shares can have such different after-cost expectancy that they are effectively two strategies.
Faster panic recoveries turn old settings into obstacles
As noted above, the 2020 and 2025 panics each recovered faster than the last. One veteran trader's biggest trade of his career came in a brief panic: an eight-figure night, with the market recovering the panic losses in just days.
Here is the other side of drift: when the structure changes, old settings block new opportunities. If your panic-bounce strategy still sets holding periods and targets for a recovery that takes months, it will shake you out in exactly the days when the bounce is strongest. In a panic, be more open about how big and how fast the rebound can be (Lesson 7 covers recognizing high-volatility conditions).
The same year: short the bubble, stop the momentum longs
In 2025, the most stretched names in quantum computing and rare earths started to look a lot like 2021 bubble stocks at their tops. One trader used the 2021 template he had studied to short them, and caught the second leg down after a bounce made a lower high.
At the same time he stopped buying momentum breakouts, so he did not give back what he had made. Many peers stayed fixated on the long side and missed that momentum was falling apart. Lesson 7 covered the long-momentum side of the same quantum names in the previous cycle; this is the other end: recognizing drift at the top of an uptrend and stepping aside. That is what a varied playbook buys you. When drift arrives, you still have other cards.
2022: those who struggled most adjusted slowest
Lessons 7 and 17 both covered 2022. Most momentum longs had a hard year, and the ones who struggled most shared a trait: they were the slowest and most stubborn about adjusting expectations and strategy. 2020 was huge, 2021 kept going, so they assumed 2022 would repeat.
In this lesson's terms, their problem was not the lack of a monitor. It was having only an all-time average. Two strong years propped it up, the early signs of 2022 were diluted inside it, and by the time the equity curve finally turned, most of a year had passed.
Common mistakes
1. Declaring the edge dead after one losing week. The error on 10 trades is close to $7; a week tells you little. Fix: treat the last 30 trades as the smallest unit for diagnosis, and only record until then.
2. Blaming luck for a long decline. Fix: after 30 trades, list setup quality, win rate and violations, and see whether any of the three is moving.
3. Not pulling back after a great year. You write "don't expect this every year" in December, start January near the highs, and decide it can keep going. Writing the reminder and following it are different things. Fix: write the risk-reduction trigger as a number, and write it in a good year, when you least believe it will fire.
4. Treating identity as strategy. Fix: every quarter, ask whether current conditions support the kind of trading you want to do, and whether you have a backup setup if the answer is no.
5. Changing rules but mixing old data. Fix: new version, new count; old data only suggests hypotheses.
6. Deleting bad samples after the fact. You see you lose more in low volatility, delete the low-volatility history and recompute a pretty curve. Fix: write "no trades in low volatility" into a new version and forward test it.
7. A brake with no release. If the trader in the opening had held on to "September will be slow," he would have given away some of the best weeks of the year. Fix: write the brake and the release together.
Where this applies
- Strategies with too few trades cannot be diagnosed. At a few trades a month, filling a 30-trade window takes most of a year. The practical move is to lower risk and wait for the sample.
- A bad year is not necessarily drift. Take any ten years and you may get two excellent, two terrible and the rest ordinary (more in Lesson 30). Normal good and bad years and structural change look alike in a single year; the two early signs, setup quality and win rate, are what separate them.
- The structural changes above are observations from US equity day and swing trading. On your instruments and timeframe, check them against your own records.
In FX and CFDs, drift often shows up in the cost column first. On the same currency pair, a broker changes its price feed or widens spreads, or you move from a liquid session to the early Asian session, and the signal is unchanged but after-cost expectancy can be cut in half. When central bank policy cycles turn, the mix of trending and ranging conditions changes too. So add two columns to the FX monitor: actual spread per trade, and win rate split by session.
Practice: write monitoring rules for the Lesson 17 trader's 2022
Materials: "The whole menu didn't fit the market" from Lesson 17. In 2022 moves followed through far less, and his options strategies depended on follow-through. There was no single huge loss; many strategies stopped fitting the market at once. He only tightened up after most of a year.
Steps:
- Which of the four causes (luck, execution, cost, market) does his story support, and why?
- Design three monitoring metrics that would have sounded the alarm in the first two months, before he hit the brake. State how the data is collected and where the warning line sits.
- Write the action once triggered: how many fewer trades, which strategies stop, which continue.
- Write one release condition, using the September in the opening as a guide.
Scoring (out of 10):
- 2 points: identifies market change and explains how it differs from execution and luck.
- 3 points: all three metrics are observable in advance, warning lines are numbers, and at least one is an early sign such as setup quality or win rate rather than P&L.
- 2 points: actions are specific, such as fewer trades or pausing a strategy type, not "be more careful."
- 2 points: includes a release condition, matching the two-way check.
- 1 point: rule changes are written as a new version.
Reference: metrics could be "share of options signals that get follow-through," "A setups per week" and "violations per week," each with a warning number. The action is "pause the options strategies, halve total trades, B and above only." The release is "follow-through share back to the testing-period level for three weeks running." An answer whose only actions are to trade less or adjust your mindset gets 3 at most.
Each week, import your trades into the trade journal analyzer and compare all-time with the last 30 trades. Use the expectancy calculator to recompute after-cost expectancy from your latest win rate and payoff. When you can't tell luck from trend, run your baseline through the Monte Carlo simulator and see how common your recent stretch is among random paths.
Tools you can use
- Trade journal analyzer: group by setup, session and conditions, and compare the rolling window with all-time.
- Expectancy calculator: recompute net expectancy as soon as cost or win rate moves.
- Monte Carlo simulator: check whether a bad last 30 trades can be explained by normal variation.
How this connects
- Upstream: Lesson 26 sets up the forward sample and versioning rules, and the monitor here is built on those records. Lesson 7 covers trending, ranging and high-volatility conditions, the background for cause 4.
- Downstream: Lesson 16 covers stopping the bleeding and forced risk cuts, and Lesson 17 covers the drawdown playbook; the diagnosis here is what triggers them. Lesson 30 uses the diagnosis to decide whether to continue, pause or quit.
- Same thread: Lesson 23 traces mistakes to root causes, and this lesson traces market changes the same way. The distribution triggers in Lesson 15 use the early signs described here.
Practice this lesson in NQ Replay
Compare the statistics from your recent replay sessions with earlier ones to spot drift in what you actually trade. NQ Replay is our own app for practicing on past NQ futures sessions, replayed tick by tick in simulation, with bracket orders, prop-style loss limits and per-trade review. You can request a free 7-day trial; you'll need your own licensed NQ tick data.
Previous and next
For educational purposes only. This is not financial advice and makes no promise of returns. Tickers, dates and market moves in real trade examples come from public sources. Individual P&L and record figures have been adjusted. Illustrative figures are the author's own. Trading involves risk of loss.
Test it in the calculator
Your last 30 trades can be negative with the edge intact
For the same positive-expectancy strategy, how many rolling 30-trade windows fall below zero?
Example (our numbers): win $9 70% of the time, lose $15 30% of the time, expectancy +$1.80. About 16% of separate 30-trade blocks are negative. Over 300 trades split into ten such blocks, the chance at least one block is negative is above 80%.
Open the Monte Carlo simulator