
In one line: a playbook is your edge written down. The mechanism can be shared across markets; the parameters cannot. Sessions, 1R, costs, leverage caps and trading channels get written separately for NQ, BTC and ETH, and the stats are kept separately too.
Lesson 28 of the 30-part Trading Decisions course. By Eliza.
Lesson map
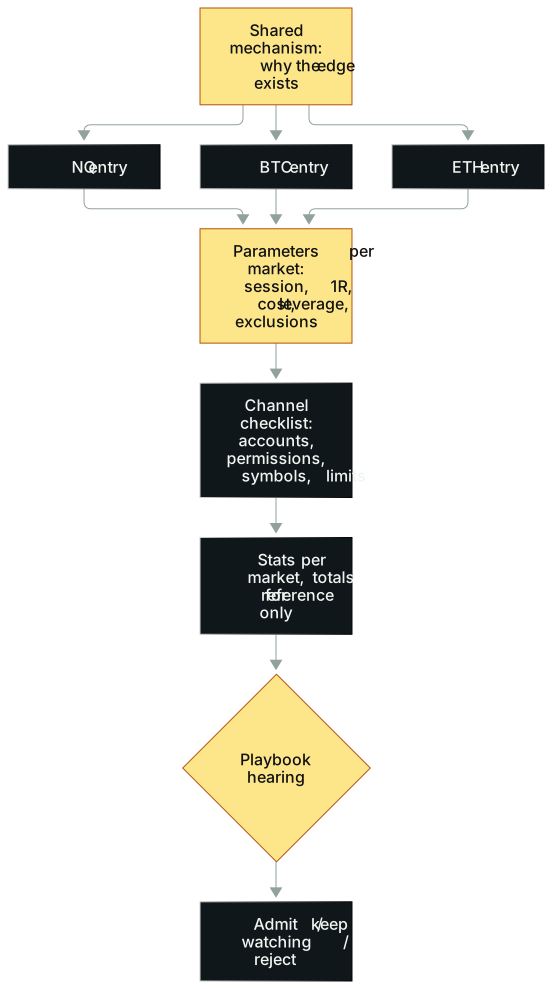
In words: (1) Write one shared mechanism that can be proven wrong, explaining why the setup has an edge. (2) Write a nine-field entry each for NQ, BTC and ETH. (3) Fill the parameter layer per market: session, 1R in points and dollars, costs, leverage cap and exclusions. (4) Before an entry goes live, tick the channel checklist: accounts, overnight and weekend permissions, contract symbols and order limits. (5) Keep stats per market; the combined total is for reference and never used to hand out risk. (6) Hold a playbook hearing. Each entry gets exactly one of three outcomes: admit, keep watching, or reject.
Opening: he never looked up what the company does
A veteran trader who often hunts in biotech names that are moving on news was invited to walk through two of his signature trades. The host asked the obvious questions: what kind of trade was it, how did you find it, and what drew you in?
The first was a reversal. On December 8, 2025, Structure Therapeutics (GPCR) released mid-stage data for an oral weight-loss drug, and the stock more than doubled by the close. He admitted he knows nothing about biotech. He didn't know what the company did and, to be honest, never looked it up.
What he watched was something else. The news had been out for hours, and then the stock went parabolic again. On the 2-minute and 5-minute charts, price had blown through the outer Bollinger Band. Volume was enormous relative to the average day. The last few candles kept getting bigger, on rising volume.
He went short, targeting the 10- and 20-period moving averages. About ten minutes later price was back at the 20-period line, textbook. His stop sat just beyond a round number above the high; he likes shorting in front of psychological levels. He doesn't remember the exact prices anymore, only that the potential reward was somewhere between three and five times the risk.
The second was a continuation. On October 6, 2025, AMD announced a large chip deal with OpenAI, and the news broke premarket before he was at his desk. The stock ripped, then built a clean, tight consolidation just under the high. He drew a small wedge. A break of that wedge on volume often brings a second leg, and the lower edge of the range was where the idea failed. An Amazon earnings report ran on the same script: he knew the report hinged on AWS, used a news scanner to confirm quickly that the AWS numbers were strong, and took part in the first move. Then the stock went sideways right under the high, he drew another small wedge, and he expected it to keep drifting after hours.
The host pushed on behalf of the audience: how can trading one wedge possibly be an edge? His answer was plain. Big news is rare. Huge volume is rare. A setup like this might genuinely show up only a few times a week.
Lay these trades side by side and each fills the same form: the catalyst (drug data, a contract, AWS), the location and shape (a parabolic move outside the bands, a tight consolidation with a small wedge near the high), the trigger, the target and exit, and where the stop goes. That is the skeleton of a playbook entry. A playbook whose only content is the word "wedge" carries about as much information as one reading "get rich."
This lesson moves that skeleton onto NQ, BTC and ETH, one entry each, with separate books.
The idea
What a playbook is
A quarterback has a playbook: plays that have been drilled and can be run in a game. A trader's playbook holds the setups you have studied and documented, so you know how to trade them well when they appear in the session. Put simply, a playbook is your edge written down.
It is not an encyclopedia of chart patterns or an indicator manual. It does one job: systematically record and improve your best trades, turn the setups into rules, keep refining them, and size up with confidence once the data is there. New traders are drinking from a fire hose. A playbook compresses everything into a few core strategies.
The best traders are usually the most obsessive about detail. Their daily report cards, playbooks and reviews are extremely specific. They know which variables to look for in a trade, what makes an opportunity better or worse, and they have the data behind it.
Mechanisms can be shared; parameters can't
Many strategy ideas carry across timeframes and markets. Most traders are doing one of two things: trend continuation or mean reversion. The Nikkei crash in Lesson 10 used a day trader's long-practiced idea of a reversal after capitulation, with the holding period stretched from minutes to days.
That gives the playbook two layers:
- Mechanism layer: why the setup has an edge, such as "a wave of panic selling overshoots, then price turns." This layer can be shared across markets.
- Parameter layer: session, volatility unit, cost, liquidity, leverage and the event calendar. This layer has to be written per market.
The same mechanism does not mean the same expectancy, because the people on the other side of your trade are different in each market.
Why the three markets get separate files
A US equity trader with more than a decade of experience once ranked four markets: stocks first, crypto second, futures third, FX last. The core reason was efficiency. The bigger the market, the more global attention and the more professional the participants, the more efficient prices are and the harder it is to make money.
- Futures: good liquidity, reasonable fees and safe brokers, but tough competition. Much of the flow comes from professional firms and automated systems. You can find an edge, but it is hard to pick up the gaps that frightened people leave behind, the way you can in less efficient markets.
- Crypto: on the things that matter most to traders, it is the least efficient. News spreads a beat late, participants amplify each other, price can run further than it "should," and the average opponent is less skilled. The costs are just as clear. Leverage is dangerously high; some people trade at 100x or more, which is close to buying a front-row ticket to the trader graveyard. There is also venue risk, custody risk and regulatory risk.
For the three playbooks, that means:
- NQ's other side is mostly institutions and algorithms. The entry needs strict focus conditions and tight cost control, never an "all day" rule.
- BTC and ETH offer more frequent opportunities and more extreme moves from news and liquidation cascades. Their entries need two extra fields: a leverage cap and venue rules.
- Participants, sessions and costs differ across all three, so the samples can't be mixed.
The method
1. Five steps to file a setup
Build every setup the same way:
- Pick a setup that suits you. For example a post-earnings breakdown, a reversal after capitulation, a reclaim of VWAP, or a breakout on a trend day.
- Record the context. What was the broad environment, what was the catalyst, what was sentiment like, and who was trapped?
- Take screenshots. Clearly mark entries, exits, risk levels and what you were thinking.
- Grade it. A+, B or C, and why? How could you size it up next time?
- Repeat. Refine the setup, track the data, and size up next time only if the data supports it.
Two details. First, the playbook itself holds curated A+ examples, not every trade, because the goal is quality and repetition. The stats page is separate, and every qualifying opportunity goes into it, winners and losers alike. Second, sizing up has a bar. Start with a dozen-plus charts, ideally many more, work out the variables and rules, test them with a backtest or a forward test, and commit real risk only after they show positive expectancy (Lesson 26).
2. Focus conditions
Out of thousands of stocks, most traders have perhaps twenty names on a given day with real positive expectancy, and often fewer than five that actually move their P&L. Focus conditions fall into three groups:
- News catalyst: price and volume genuinely moving. News alone isn't enough.
- Technical catalyst: a high-volume break of a level that held for months, or a squeeze that runs for days.
- Volatility and range: moves several times the average range, with clear key levels.
This isn't only for stocks. Precious metals, crude and crypto all take their turn as the focus market. You are looking for the market going through heavy price discovery, with shifting sentiment and order flow from different kinds of participants arriving at once.
3. The nine-field entry
| # | Field | What to write |
|---|---|---|
| 1 | Version and date | Keep old versions on every edit |
| 2 | Market and allowed sessions | When this market may be traded |
| 3 | Environment and focus conditions | The mechanism, and whether today qualifies |
| 4 | Trigger | Visible entry conditions |
| 5 | Invalidation | Where the idea is proven wrong; the stop |
| 6 | Size and cost assumptions | 1R in points and dollars; slippage, fees, funding |
| 7 | Management and exit | Scaling, trailing, time exits |
| 8 | Exclusions | Lookalikes that don't count as this setup |
| 9 | Sample summary and grade | Results from a continuous sample; counts of A+, B, C |
Field 8 is the one most often skipped. A rule with no exclusions can explain any move after the fact, so it can never be tested (Lesson 5).
4. What differs across the three
The numbers below are our own, used to show what has to be written separately. Contract specs, sessions and fees should come from the latest notices of the exchange and your broker.
NQ.
- The cash open and close and the overnight futures session are two different environments; write them separately. Give macro data days their own line: in 2022, every monthly CPI release could swing the whole market.
- Contracts roll quarterly. The entry says which contract you trade and when you roll.
- The standard contract is $20 a point; the micro is $2 a point. Set 1R at $300 with a 15-point stop: one standard contract is exactly $300, or 10 micros. Widen the stop to 25 points and one standard contract is $500, over budget, so you switch to 6 micros.
BTC.
- It trades around the clock, and weekday and weekend participants differ. The entry separates them.
- Set 1R at $300, go long at $60,000 with a stop at $58,800. Risk is $1,200 per coin, so the position is 0.25 BTC, $15,000 notional.
- Write the leverage cap as a number. With a simplified isolated-margin formula, entry × (1 − 1/leverage + 0.5%), using a 0.5% maintenance margin rate, 10x puts liquidation near $54,300, 25x near $57,900, and 50x near $59,100, ahead of your stop. The stop never gets a chance to fire; the exchange closes you out and charges a liquidation fee on top. Use your exchange's own calculation for the real number.
- Venue and custody risk belong in the entry, not in a "personal notes" section.
ETH.
- Highly correlated with BTC, but with its own relative strength and events. The entry states whether an ETH signal needs BTC moving the same way or stands on its own.
- Same 1R of $300: long at $2,500, stop at $2,400, $100 of risk per coin, 3 ETH, $7,500 notional. For the same setup, the ETH stop often needs to be wider in percentage terms than the BTC stop.
- Liquidity is good among major coins, but give slippage in extreme moves its own column.
Costs get their own column too. Take the BTC trade's $15,000 notional. Assume a 0.05% taker fee each way: a round trip is about $15 (assuming the notional stays near $15,000 on both legs), or 5% of 1R. So the $300 in these examples is price risk before costs: a BTC stop-out really costs about $315. Either define 1R that way in the entry, as here, or trim size until costs fit inside it. Assume funding of 0.01% every 8 hours: holding a full day costs about $4.50. That is noise for a day trade. Hold for a week and it belongs in field 6.
5. The chart template
Lesson 8 covered the four-chart setup: a 2-minute intraday chart for decisions, a 3-month daily for recent strength, the tape for the order book, and a 3-year daily for the long backdrop. These charts don't work in isolation. An intraday chart can look extremely strong and, zoomed out, be running into a huge daily resistance. The weights shift with conditions, catalysts, volatility and timeframe.
Carry this into the three playbooks by giving each entry a chart template: which charts this setup uses and what each one is for. BTC and ETH trade all day, so VWAP needs an anchor. Fix in the entry where it starts: midnight UTC, the US equity open, or the moment of the event.
6. Stats per market, totals for reference
The Lesson 3 example of five accounts where only the winning one gets shown applies just as well to markets. Keep the stats page by market, compute net expectancy for each separately, and put the total on the last line for reference only, never to hand out permissions. Until a market's sample meets the bar, none of the three earns a bigger risk allowance on the grounds that the combined total is positive.
7. The channel checklist
Channels only have value before the move. The peak of a panic won't wait while you fill out an account application. On that night in Lesson 10, a futures account and overnight permissions set up in advance decided whether the trade could happen at all, and when an account's limits are maxed out, the platform will just as readily reject the order for insufficient buying power. Before an entry goes live, tick every line:
- Accounts: futures account and crypto exchange account opened and approved.
- Overnight and weekend permissions: NQ's overnight session; weekends for BTC and ETH.
- Contracts and symbols: the current contract symbol and the next roll date.
- Margin and limits: the maximum order size per market and the account's buying power ceiling.
- Costs: fees, spreads and funding, written into field 6.
- Funding the account: where the money comes from and how long transfers take.
- Backup channel: how you close positions if the main platform disconnects.
More real cases
October 10, 2025: the largest liquidation cascade
On October 10, 2025, the crypto market had a historic flash crash with record forced liquidations, driven by too much leverage piled up across the system. Some coins briefly traded at half their equilibrium value or less, and ETH fell roughly 20% at one point that day.
If you had spare cash and no leverage, some of those moments may have been among the highest-expectancy opportunities you will ever see. The veteran from the opening handled this event in a way that gives the ETH entry a ready-made example. If you were at the screen with no direct crypto exposure, you could buy ETH after its drop of about a fifth and catch a decent bounce. The shape he described: a clear wave of downside order flow, overextended, slammed well below the lower Bollinger Band, a full flush, then a clean bounce back to the 20-period moving average.
In nine-field terms: environment, a leverage-driven liquidation cascade; trigger, price punching far through the lower band with a flush; management, target the 20-period average; exclusions, you already hold direct crypto exposure or you are using high leverage. Notice the condition about no direct exposure and no leverage. It is a condition for the opportunity and a condition for the risk. Traders running 50x that day were the fuel for the flush, not the ones buying it.
An entry can say "don't"
Lesson 6 covered BTC sitting between 80k and 100k dollars for two months. Plenty of people got bored, sold options, and then price broke through the bottom of the range. In a playbook, a note stating that every breakout entry is switched off while price sits in the middle of that range is worth more than one more setup. Exclusions are entries in their own right.
Leaving your strength is also a loss
The trader in Lesson 5 left his own lane out of fear of missing the earnings trades someone else was good at, forced himself to learn them, and lost a good deal of money along with years that should have gone into sharpening what he already did well. That doesn't contradict going where the action is. The safe path runs both ways: first refine what already works, then expand to new markets one step at a time, each step going through research, records and filing, never a one-off chase.
Identity keeps new markets out
Some people hold a deep identity about what they do and don't trade: "I'm a small-cap trader." So big moves like MSTR and SMCI play out while they stand outside. That doesn't mean you have to trade them, only that you're willing to study, plan, record and put them on the candidate list. For readers of this lesson, the question becomes: if you only trade NQ and crypto has another day like October 10, does your playbook have a watch-list entry for it?
Common mistakes
1. The playbook becomes an album of winning screenshots. Fix: the playbook holds A+ examples and counterexamples; the stats page holds every sample.
2. Using one set of numbers for all three markets. The same stop in points and the same session mean completely different things in NQ, BTC and ETH. Fix: write fields 2 and 6 per market and compute 1R for each.
3. Letting the total hide a negative market. Fix: list net expectancy per market on the stats page, with the total on the last line only.
4. Treating gross results as net. Costs differ widely across the three, especially slippage in extreme moves and funding on held positions. Fix: state cost assumptions in field 6 and record only after-cost numbers.
5. Choosing leverage first and the stop second. If leverage pulls liquidation inside the stop, the stop is decoration. Fix: set the stop and 1R first, then the size, then confirm liquidation sits beyond the stop with room to spare.
6. Arranging channels only when you need them. Fix: tick the checklist before an entry goes live and write order limits into the entry.
7. Treating the playbook as an identity. Fix: once a quarter, go through the playbook and ask whether a new market belongs on the candidate list.
Where this applies
- This framework comes from US equity day and swing trading. Moving it to futures and crypto is an adaptation and has to prove itself through the forward testing in Lesson 26.
- You don't need all three markets. If you trade one, build one file and keep the other two as watch-list entries until you have the channels and the attention to promote them.
- Playbooks fit strategies that can be described by rules and whose pre-entry information can be saved. Feel that can't be written down doesn't belong in an entry.
- Contract specs, sessions and fees change, so check the parameters in each entry regularly.
If you trade CFDs such as NAS100 rather than exchange-listed NQ futures, rewrite the parameter layer from scratch. Brokers price NAS100 differently per lot per point, $1 at some and $10 at others; spreads and overnight financing differ too, and weekend and holiday hours may not match the futures. Before you trade, confirm your broker's terms with the PipGauge contract spec checker, then convert your stop in points into dollars with the NAS100 point value calculator. The entry carries your broker's numbers, not the ones in someone else's screenshot.
Practice: a playbook hearing
Materials: pick one shared mechanism. We suggest a reversal after a panic overshoot, or the ETH case's drop outside the lower Bollinger Band followed by a return to the 20-period average. Choose at least two of NQ, BTC and ETH.
Steps:
- Write a nine-field entry for each market. The mechanism field is identical; the parameter fields must differ.
- Add screenshots of two examples and two counterexamples per entry, marking what was visible at the trigger.
- Tick the channel checklist line by line, and write a date for anything not ready.
- Hold a hearing and answer three questions. Which fields can be shared? Which must stand alone? If costs double, does the conclusion change?
- Give each entry exactly one decision: admit, keep watching, or reject.
Scoring (out of 10):
- 2 points: the mechanism layer is falsifiable, with no phrases like "feels strong."
- 2 points: the parameter layer is set separately for each market: sessions, costs and leverage caps differ, and 1R is decided per market even if it ends up as the same dollar amount.
- 2 points: every entry has exclusions, and the counterexamples have clear boundaries.
- 2 points: stats are per market and the total isn't used to grant permissions; the crypto entries confirm liquidation sits beyond the stop.
- 2 points: the channel checklist is complete, decisions are backed by evidence, and rule changes open a new version.
Reference: an entry whose whole rule is "pullback after breakout" and uses one stop size for all three markets scores 4 at most. Using a single winning trade as the case for admission scores zero.
When writing the BTC and ETH entries, start with the position size calculator to turn 1R and the stop distance into a size, then use the liquidation price calculator to confirm that at your planned leverage liquidation sits beyond the stop. The crypto profit calculator folds fees into each trade's net result. For NQ and NAS100 point values, use the PipGauge NAS100 point value calculator.
Tools you can use
- Position size calculator: work back from 1R and stop distance to a size in each market.
- Liquidation price calculator: make sure leverage hasn't pushed liquidation inside your stop.
- Crypto profit calculator: fold fees into the net result of each BTC and ETH trade.
- PipGauge NAS100 point value calculator and contract spec checker: check point values and contract specs for NQ and NAS100.
How this connects
- Upstream: Lesson 5 defines setups and exclusions, Lesson 8 covers multiple timeframes, Lesson 13 works size back from the stop, and Lesson 26 covers forward testing. This lesson packs them into entries for three markets.
- Downstream: the Lesson 27 monitor gets built per market; the 60-day plan in Lesson 29 draws its daily practice material from these entries; Lesson 30's continue, pause or quit decision is made market by market.
- Same thread: Lesson 9 on news and event risk feeds field 3; the night in Lesson 10 shows why channels have to be ready in advance; Lesson 21 explains why the same veteran trades so little.
Practice this lesson in NQ Replay
The NQ playbook from this lesson can be drilled directly: one replay session per playbook entry, then check the trade review against that entry's written rules yourself. NQ Replay is our own app for practicing on past NQ futures sessions, replayed tick by tick in simulation, with bracket orders, prop-style loss limits and per-trade review. You can request a free 7-day trial; you'll need your own licensed NQ tick data.
Previous and next
For educational purposes only. This is not financial advice and makes no promise of returns. Tickers, dates and market moves in real trade examples come from public sources. Individual P&L and record figures have been adjusted. Illustrative figures are the author's own. Trading involves risk of loss.
Test it in the calculator
Check the liquidation price before the stop
At the leverage you plan to use, does liquidation arrive before your stop?
Example (our numbers, simplified formula): long BTC at $60,000, stop at $58,800. At 10x, liquidation is near $54,300. At 50x it is near $59,100, ahead of the stop.
Open the liquidation price calculator