
In one line: a review has three steps. The fact layer holds only what orders and charts can verify. The interpretation layer needs at least two competing explanations, each with evidence for and against. Causes go into three bins, and each one gets a guardrail with a trigger, an action and a release condition.
Lesson 22 of the 30-part Trading Decisions course. By Eliza.
Lesson map
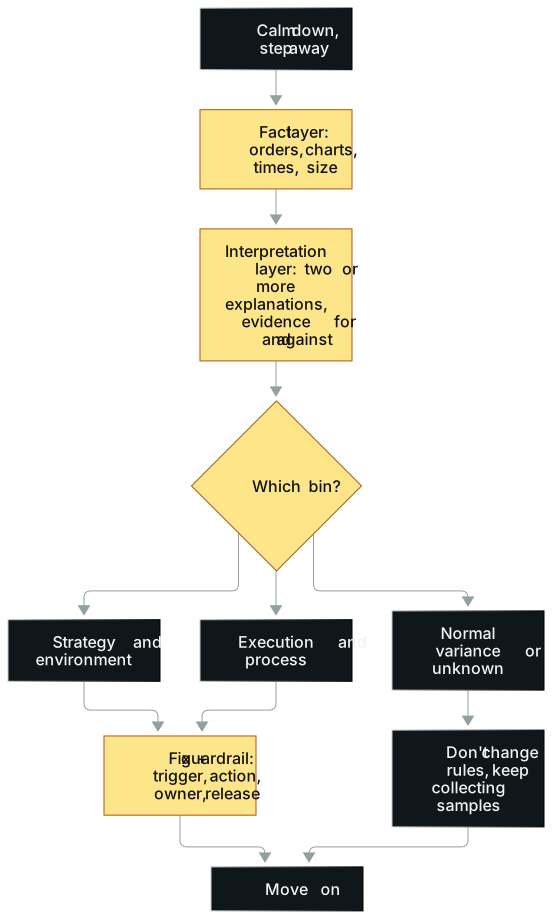
In words: (1) Don't write anything until you've calmed down; step away from the keyboard first. (2) The fact layer holds only what a third party could check against your orders and charts. (3) The interpretation layer needs at least two competing explanations, each with evidence for it and evidence against it. (4) Put the cause in one of three bins: strategy and environment, execution and process, or normal variance and unknown. (5) The first two bins get a fix and a guardrail that names its trigger, action, owner and release condition. The third bin changes no rules; you keep collecting similar samples. (6) Then you move on.
Opening: forty-odd minutes, one playbook trade
On November 2, 2021, about an hour after the US open, a senior US equities day trader saw Avis Budget Group (ticker CAR) on his new-highs scanner.
Before the trade, here's what he was carrying. The year before, he'd posted the best single-year result his prop firm had on record, eight figures. This year he wanted to push it a notch higher, past a round number nobody at the firm had reached in twenty years. The start was spectacular: within two months he'd covered most of the distance. Then the market slowed, the curve went flat, and the calendar kept turning. By November the line looked out of reach.
By then, he said later, it wasn't about money. It was about proving how far he could push himself. A number and a deadline: the goal had taken a seat at the desk before the trade even began.
Avis posted the release after the US cash close on November 1, 2021, at 4:06 p.m. ET, and set the call for 8:30 a.m. ET on November 2. The company headline is a new record in net income and adjusted EBITDA, and the release calls that quarter's adjusted EBITDA the best in the company's history. That is not an unremarkable report. The trader later said electric-vehicle remarks on the call drew attention; this article does not treat that attribution as a verified cause of the move. It was still 2021. The GME and AMC frenzy was only months old, and even bankrupt Hertz had been bid to the moon. He later described CAR's float as small, the short interest as high and the liquidity as thin. The stock ran from around $180 to around $385, more than doubling.
This was exactly his specialty: an overextended parabolic squeeze with no fundamental support, apparently ripe for mean reversion. Earlier that year he'd caught the tops in GME and AMC with the same approach. Those were the biggest winners of his career at the time.
He took a small starter short during the run. The real trigger came when price finally turned and broke below the prior intraday candle's low. There he went in heavy, too heavy, he'd admit, with one thought running: this is the one that gets me over the line and puts my name in the firm's record book.
At first it worked. The stock dropped, he kept adding, and the open profit quickly reached the hundreds of thousands. Then trading was halted for volatility, which in his experience often meant the top was in.
It wasn't. After the halt the stock chopped near the highs, then launched a second leg. A fully loaded short had no cushion and no exit. He stopped out around $385. From going heavy to taking the loss, about forty-odd minutes passed. It was one of the largest losses of his career, seven figures.
After his stop, the stock kept going to around $550 before it came back down. Even if he'd wanted to hold, he couldn't. He'd hit his maximum daily loss, and risk management wouldn't let him trade again. The hit-the-line-and-stop rule had been there since he started, when his daily allowance was $120. The allowance grew many times over. The rule didn't change.
He stepped away from the screen in a daze. I've traded that exact pattern so many times. Did that just happen?
Once he'd calmed down, he did what this lesson teaches: he took the trade apart, with three questions, each a layer deeper. Was the trade in his playbook? Yes, it was the reversal setup that had made him money all year. Where was the main mistake? Not really execution. Size. Why was the size so big? Because an outcome goal had made the sizing decision for him.
His conclusion: the setup was worth trading, and he'd take the same chart again, but never at that size. Three years later, having dropped external targets, he had his best year ever in 2024, with a single best trade worth eight figures (Lesson 20 covered what it cost his body).
The story contains three moves: freeze the facts, then interpret, then build the guardrail.
The idea
The fact layer: only what a stranger can verify
Reread the opening and you'll find two kinds of sentences mixed together.
One kind is a checkable statement, which is not the same as a statement this article has already verified. The company release is timestamped 4:06 p.m. ET on November 1, 2021, and the call is set for 8:30 a.m. ET on November 2. That timeline, the record net income, and the best quarterly adjusted EBITDA are on the announcement: https://ir.avisbudgetgroup.com/news-releases/news-release-details/avis-budget-group-reports-new-record-net-income-and-adjusted. The rest is the trader's account: about an hour after the open, CAR on his new-highs scanner; a run from about $180 to about $385; an add after price broke the prior intraday candle's low; a volatility halt, a chop, then a second leg; a stop near $385; a later high near $550. Prices and the halt would need a market record. The scanner, the add and the stop would need his tape or fills. This article does not have those records, so those items stay his account and are not upgraded to independently verified facts.
The other kind is interpretation. "This was leftover meme sentiment." "Ambition was driving him." "The goal set the size." "The halt signaled the top." These are inferences. They might be right or wrong, and all of them need evidence.
What belongs in the fact layer: higher-timeframe and execution-timeframe charts, event times, orders and fills, planned and actual size, the pre-written invalidation level, stop-adjustment history, the strategy category, the news and liquidity visible at the time, and state scores before, during and after (Lesson 20). What doesn't: "The market hunted my stop." "I was too greedy." When key evidence is missing, write "unknown" rather than filling the gap in a confident tone.
In the Avis trade, the biggest gap is size itself. The public accounts give no figure for planned or actual size. So in the evidence file, "the size was too big" is, for now, the trader's own conclusion. It becomes a fact only once the numbers are added.
Why freeze the facts first? Because what happens later rewrites memory. After the stop, the stock ran to $550. Review with that number in view and the stop looks like it saved him. If the stock had reversed instead, the same stop would be retold as "shaken out." One action, two stories. So the fact layer stops at what was visible at the moment of exit. Where price went next proves neither that the stop was right nor that it was wrong. By the same logic, a winning trade doesn't excuse a chase or an unauthorized jump in risk.
The interpretation layer: evidence for, and evidence against
"FOMO made me chase" is just a label. Evidence for it might be: entered three minutes after the trigger, no plan written before entry, a spike in outside chatter at the same time, size above plan. Every claim should point to specific lines in the fact layer.
Better still, write two or more explanations side by side, each with evidence for and against. Here's a try with Avis. This is our analysis, not the trader's own:
- Explanation A: the setup failed that day. For: small float, high short interest, thin liquidity and meme memory are all conditions that let a squeeze run further than usual. Against: he'd faced the same conditions in GME and AMC earlier that year and made money.
- Explanation B: size and motive went wrong. For: the position had no cushion, the second leg left him nowhere to go, and he ended at the daily loss limit. Against: none found so far, and the trader agrees.
- Explanation C: normal variance. For: the setup qualified. Against: once size is that oversized, the loss is no longer the kind of number variance explains.
Taken together, B holds. A partly holds: it explains why the second leg was so violent, but not why the loss was so large. C doesn't hold.
Three bins for causes
- Strategy and environment: the rule itself has no edge in this environment, or the market's mechanics changed.
- Execution and process: the setup was valid, but entry, size, exit or permissions broke the plan.
- Normal variance and unknown: rules and execution were both fine and a single trade can still lose, or there isn't enough evidence to pin down a cause.
Keep the third bin. If every loss must produce a mistake, you'll keep rewriting rules on tiny samples until the strategy only explains the past. On the other hand, traders love blaming losses on bad luck or a broken market. So the third bin needs an entry bar: the rules passed, execution passed, and nothing outside the sample points elsewhere.
From cause to guardrail
Plenty of reviews stop at why it lost and never reach what to do next. One trader who has trained many newcomers calls this one of his biggest frustrations.
Causes and fixes should map one to one:
- Counter-trend entries: before every entry, write down the intraday and daily trend. If you're holding against the trend, exit and wait for a reversal trigger before re-engaging.
- Off-playbook trades: before entering, name which category the trade belongs to. If you can't, don't place it.
The fix then needs to become a guardrail: who enforces it, when it triggers, what happens when it does, and what evidence lifts it. Whatever you can hand to a system, don't leave to willpower. Set the daily loss limit at the broker, and if your broker can't, switch brokers. Some traders write a small script that locks order entry when the line is hit.
Here's what a guardrail for the Avis trade might look like in that format (our own example):
| Item | Content |
|---|---|
| Cause | Execution and process: an external goal entered the sizing decision |
| Fix | Size comes only from the playbook's risk formula; the goal number plays no part |
| Trigger | Before submitting any entry order |
| Action | Write size and invalidation price first; missing either, no order. Above the playbook's per-trade risk cap, the platform rejects the order |
| Owner | The broker's or platform's risk settings, not in-the-moment self-control |
| Release | Only after 25 consecutive trades sized within the playbook do you discuss loosening it |
The 25 is an example. Adjust it to how often you trade.
Winners get reviewed too
The facts-then-interpretation structure isn't only for losses. Winning trades often hide rule breaks the result covered up. Celebrating a green day with terrible discipline and beating yourself up over a red day with flawless execution gets the grading exactly backwards.
Showing up isn't the same as improving
Think of a golf driving range with two people on it. One dumps a bucket of balls and starts swinging: no target, no feedback, no adjustment. The other brings one or two specific things to work on and, after every swing, asks: did that meet what I intended? What do I change on the next one? They spend the same hours on the range. A few years later they're far apart.
A trade review is the question the second golfer asks after every swing.
The method
Step 1: Calm down, then write
Don't review while angry, deeply discouraged or rattled. Take a walk, get some air, or sleep on it. On the Avis day, the trader also stepped away and waited until he was calm before taking the trade apart.
Step 2: Freeze the facts with a template
A template is faster, leaves less to improvise and makes it harder to skip something. A workable single-trade template can run in this order:
- Date, ticker, P&L.
- Trade category, matching your playbook: swing, intraday, breaking news, IPO, open or close imbalance. This column decides whether you can ever aggregate. Never leave it blank.
- Context: news, the broad market, why it was in play, market cap, short interest, float, fundamentals.
- Daily and intraday charts, with images and analysis: what came before, volume, support and resistance, any news gap.
- Order book, if relevant: large buyers or sellers, which side was more aggressive.
- What I did: whether I followed my system, how emotion affected me, size and execution.
- What others in my group did.
- The ideal: ideal size, ideal entries and exits, how to adapt mid-trade.
- How to find more opportunities like this.
- Fixes and other takeaways.
Two items get skipped most and are worth the most. Item 2, the category tag: without it you can't aggregate. Item 9, finding more: scans, alerts or splitting coverage with others turn one good opportunity into a category of them.
Step 3: Write explanations, each with evidence for and against
Write at least two competing explanations and mark which fact-layer lines each relies on. If you can't write evidence against one, label it "unverified" and don't settle on it yet.
Step 4: Bin it, fix it, guard it
Put the cause in one of the three bins. Causes in the first two each get a fix, and each fix gets all four guardrail parts: trigger, action, owner, release condition. For the third bin, write "keep collecting similar samples" and change no rules.
Step 5: Move on
You've learned the lesson, found the fix and set the guardrail. Stop there and don't keep chewing on it. There's a popular phrase for this: be a goldfish. Feel bad for a moment, then forget. The reason is practical. The work is done, and more rumination builds nothing. The money is gone, there's no reset button, and the tuition is paid.
Two supporting habits
- Save deep reviews for the trades that matter. At 20 trades a day, you can't spend an afternoon on each. In a year, maybe ten or twenty of your best or worst trades deserve a deep dive. Take a weekend, close the door, put on headphones and write them up properly. Writing them up is also how they stick.
- Narrate and score after the close. Use screen-recording or charting software to replay the day's key few minutes. Talk through them and score the tape as you go. Our own scale is enough: -5 is outright panic, bids pulling and liquidity vanishing; 0 is balance; +5 is euphoria, buyers lifting offers again and again. Ten minutes a day is plenty.
More real cases
Pulling up every trade of a career
The same trader, early on, already ranked near the top of his firm, but a handful of huge losses kept dragging his results down, seven figures in total. His thought: this isn't normal, and if I can eliminate the biggest ones, the rest will look much better. So he pulled up every trade of his career and dissected them one by one, like a forensic examiner, without relying on memory.
The result was strikingly clean. His best trades all went with the trend and started working right after entry. His largest losses were, without exception, counter-trend.
That finding is useful because you can apply it before the fact. You can tell whether a trade is with or against the trend before you enter, without waiting for the result. A review built as statistics beats a review built as a story: put every trade in one table and you can see which tag loses the most.
A review of a miss that scored a B-minus
A young trader completely missed a micro-cap biotech that ran from about 20 cents to nearly 80 cents in a week and finished with a euphoric blow-off top. Frustrated, he went into the office on a Sunday, wrote up the miss and sent it to the senior trader who was coaching him.
The senior trader went through it section by section. The first suggestion was to use a template: float, market cap, any press release, the daily chart, the intraday chart, the order book, why he did or didn't trade it, and how he should have traded it.
He pushed on two points. What caused the big gap down on the daily in September? Find the date and search the news, he said. Whether that news was later reversed matters a lot for judgment. And the trader had labeled the prior day a euphoric top. Based on which signs? A big gain isn't enough. You want to see acceleration.
The grade: an A by the standards of trading social media, a B or B-minus by prop-firm standards. Most reviews online are too vague, covering two or three variables. He was fair about it, too. On a dead day there's no point squeezing blood from a stone. But for a good trade you're kicking yourself for missing, this level of detail is the baseline.
The powerlifter's tripod
At the end of 2023, the same trader trained alongside an elite powerlifter, about 100 kg bodyweight with a competition total of over 700 kg. The gap was obvious.
The most direct difference was a tripod. The lifter set up a phone and filmed every set, replayed it right away and pointed out the 1% details: leg drive is good, push back a bit more through the sticking point; your right arm is weak. The trader's job was to use that on the next set. The next set started with a small hitch, because he was deliberately applying the feedback. He took that as a good sign. His attention was on, and the feedback landed immediately.
He also admitted he'd never recorded his trading, feeling he wasn't good enough to bother. Later he saw it differently: if you don't record and study the key moments, you won't improve as fast as you could.
Common mistakes
1. Filling the fact layer with emotion and motive. "I was too greedy" isn't a fact. Orders, times and size are. Fix: the fact layer holds only what screenshots and fills can verify. Emotion moves to interpretation.
2. Reviewing only losses and never checking winners for rule breaks. Fix: every trade goes through the same template, win or lose.
3. Using later price action to validate the decision. Avis running to $550 proves neither that the short was wrong nor that the $385 stop was right. It's just what happened next. Fix: hide everything after the exit and look only at what was visible at the time.
4. Explanations with no evidence against them. If every explanation follows your existing bias, the review just collects evidence for it. Fix: at least two explanations, each with one piece of evidence against.
5. Finding causes but proposing no fix. Or proposing one that nobody, no tool and no permission setting will enforce. Fix: a guardrail missing any of its four parts isn't finished.
6. Overhauling a strategy after one outlier. One loss gets treated as a rule error, and sample size and environment get ignored. Fix: bin it first. If rules and execution both passed, you're allowed to write "looks like normal variance, keep collecting similar samples."
Where this applies
This method runs on evidence. When evidence is missing, write "unknown" in the fact layer rather than filling it with guesses.
Deep reviews are for the trades that matter. On ordinary days, a short form is enough.
Don't write when emotions are extreme. A big loss can become a genuine trauma. When you need to, close the trading platform and get professional help; some professional traders work long-term with a trading psychologist. No template in this lesson replaces that.
When the cause lands in the third bin, don't invent a mistake just to have something to write.
For forex and CFD traders, the fact layer needs a few extra fields: the spread at execution, overnight financing, leverage, and the instrument's contract spec on your platform. The same chart can carry very different point values and margin rules across platforms, so confirm how much you actually risk per point before you talk about the pattern.
Practice
Exercise 1: Take Avis apart
Material: this lesson's opening.
Step 1: Sort these 12 statements into "fact," "interpretation" and "can't tell."
- The company released results after the close on November 1, 2021, and scheduled the call for 8:30 a.m. ET on November 2.
- About an hour after the open, CAR appeared on the new-highs scanner.
- The stock ran from about $180 to about $385.
- The run was leftover meme-stock sentiment.
- After price broke the prior intraday candle's low, he increased the short.
- His position was so large it had no cushion.
- Trading was halted for excessive volatility.
- The halt showed the top was in.
- He stopped out near $385.
- After his stop the stock reached about $550.
- The goal decided his size.
- At half the size, this would have been an acceptable small loss.
Step 2: For each interpretation, write one piece of evidence for and one against.
Step 3: Put it in a bin and write the fix and guardrail, with all four parts.
Step 4: Hide the outcome. Using only what was visible before entry, write a paragraph: would you approve this trade, and what sets the size cap?
Reference answer:
- Fact-shaped: 1, 2, 3, 5, 7, 9, 10. Item 1 is on the company release. Items 3, 7 and 10 need a market record this article did not obtain. Items 2, 5 and 9 stay the trader's account until his tape or fills are in hand. Number 10 happened after the exit, so it can't be used to judge the decision.
- Interpretation: 4, 8, 11. For 4, evidence for is the trader's later account of a small float, high short interest, thin liquidity and the earlier meme wave; evidence against is the November 1 release of record net income and the company's best quarterly adjusted EBITDA. Against 8: a second leg followed. For 11: the trader's own account and the get-over-the-line thought; against: the public accounts give no planned or actual size figures.
- Can't tell: 6 and 12. Number 6 lacks numbers. Number 12 is a counterfactual nothing can verify.
- Bin: execution and process. For the guardrail, see the table in the idea section.
- The outcome-hidden paragraph passes if it says the setup qualifies and can be approved, the size cap is the playbook's per-trade risk, and the annual goal plays no part. A paragraph whose main reason is "it later went to $550" scores zero.
Scoring (out of 15):
- 6 points: classifying the 12 statements, 0.5 each.
- 4 points: at least two explanations, with evidence for and against.
- 3 points: the bin is right, fixes map to causes, and the guardrail has a trigger, action and release.
- 2 points: the approval doesn't depend on later price action.
Exercise 2: Take apart one of your own
Pick a recent trade and build a four-page evidence file: a fact timeline; at least two competing explanations, each with evidence for and against; a bin; and a trigger, action, release condition and verification period. The next day, hide the outcome, look only at pre-entry information and decide again whether you'd approve it.
Scoring follows Exercise 1's 15-point structure, with the fact page worth 3 points. Treating the loss itself as a rule error, or using later price action to validate the decision, caps you at 7. If the facts show full compliance, "looks like normal variance, keep collecting similar samples" is an acceptable conclusion.
Load the last month or two of trades, tagged by category, into the Trade Journal Analyzer and see which tag carries the heaviest losses. That's where your next deep review should start.
Tools you can use
- Trade Journal Analyzer: split P&L by category tag, so your review runs on statistics instead of stories.
How this connects
- Upstream: Lesson 1 separates decision quality from outcome, and this lesson applies that to reviews. Lesson 13's sizing back from the stop prevents Avis-type problems in advance. Lesson 20's state scores give the fact layer its state record.
- Downstream: Lesson 23 takes interpretation further, into mistake, fix and guardrail as a full loop. Lesson 24 rolls single-trade reviews into a weekly scorecard.
- Parallel: Lesson 19 covers outcome attachment, where the motive layer of Avis gets its full treatment.
Practice this lesson in NQ Replay
Per-trade MAE/MFE and CSV export give you the fact layer; write the explanation layer separately, after the session. NQ Replay is our own app for practicing on past NQ futures sessions, replayed tick by tick in simulation, with bracket orders, prop-style loss limits and per-trade review. You can request a free 7-day trial; you'll need your own licensed NQ tick data.
Previous and next
For educational purposes only. This is not financial advice and makes no promise of returns. Tickers, dates and market moves in real trade examples come from public sources. Individual P&L and record figures have been adjusted. Illustrative figures are the author's own. Trading involves risk of loss.
Test it in the calculator
Split your trades by tag
With-trend and counter-trend trades blended together look survivable. Split apart, which tag is dragging you down?
Example: 40 trades total -2.5R. Split by tag, 22 with-trend trades made +9.5R and 18 counter-trend trades lost -12R. The problem isn't trading. It's one tag.
Open the Trade Journal Analyzer